
Aerial view of a bustling cityscape at night featuring vibrant traffic lights and modern skyscrapers.
Commercial lots near transport hubs aren’t just appreciating—they’re breaking away from the rest of the market. In Metro Manila’s most active corridors, land within a 200–300 meter radius of an MRT, LRT, or future PNR station has historically surged 30–50% from pre-construction to opening day. Some pockets near Ayala, North Avenue, and Recto have performed even better, outpacing surrounding districts and resetting price benchmarks entirely.
And we’re only at the beginning. With the NSCR, MRT-7, LRT-1 Cavite Extension, and the Mega Manila Subway reshaping mobility for tens of millions, the next wave of value creation is happening right now—quietly, relentlessly, and faster than most investors expect.
Developers already understand the math. Logistics operators are positioning early. Retail giants are circling for frontage near future station exits. The only question left is whether individual investors an
TABLE OF CONTENT
- Introduction — The New Battleground for Commercial Land Value
- What Counts as a Transport Hub in the Philippines?
- Why Land Near Transport Hubs Skyrockets — The Value Mechanics
- Philippine Market Data & Trends Pushing Prices Up
- Micro-Location Factors That Decide Profitability
- Investment & Financial Modeling for Commercial Lots Near Transport Hubs
- Best Commercial Uses Near Transport Hubs (With PH Examples)
- Legal, Zoning & Regulatory Essentials (Philippines-Specific)
- Red Flags & Risks Investors Often Miss
- Strategies to Boost Land Value Before Selling or Developing
- Case Studies (Short, Realistic PH Stories)
- Practical Due Diligence Checklist
- FAQs
- Conclusion — The Window of Opportunity
Introduction — The New Battleground for Commercial Land Value
Commercial land has always been prime territory in the Philippines, but parcels positioned near major transport hubs have become a different arena altogether—faster-moving, data-driven, and fiercely competitive. The moment a site falls within reach of an MRT, LRT, PNR station, airport access road, or a mega-terminal like PITX, its economic profile transforms. Visibility increases. Demand intensifies. Developers start calculating future FAR potential before commuters even arrive.
Accessibility is now the most powerful currency in urban real estate. In a metropolis where average travel times stretch beyond an hour, a property that shortens a commute—even slightly—commands immediate commercial attention. Better access means denser foot traffic, stronger tenant demand, and higher rents that outpace inflation. In a landscape defined by congestion, any parcel that solves a mobility problem becomes a premium asset.
This is why local developers, logistics operators, national retailers, and even small neighborhood entrepreneurs are aggressively targeting transit-linked lots. They know these corridors deliver what every business craves: predictable customer flow, stable income, and appreciation curves that outperform standard commercial districts. Competition isn’t cooling. With the nation’s largest infrastructure investments converging this decade, it’s accelerating.
What Counts as a Transport Hub in the Philippines?
Transport hubs are more than physical structures—they are economic engines that reorganize how people move, where businesses cluster, and which parcels rise fastest in value. In the Philippines, these hubs act as gravity centers for commerce. They shape development patterns, redirect foot traffic, and trigger the kind of densification that transforms entire districts into high-performing commercial zones. Understanding each hub type gives investors a sharper lens for identifying where the next appreciation wave will hit.
Key Transport Hubs That Influence Land Value
MRT/LRT Stations
Metro Manila’s rail system—MRT-3, LRT-1, LRT-2, and soon MRT-7 and the Mega Manila Subway—forms the spine of daily urban mobility. Stations along these lines generate some of the country’s highest foot-traffic volumes, often drawing 100,000+ commuters per day. Lots within a short walk of station entrances consistently outperform neighboring parcels because businesses anchor themselves where commuters naturally pass.
PNR North–South Commuter Railway (NSCR)
Set to link Bulacan, Manila, and Laguna, the NSCR is already reshaping expectations for land values outside traditional CBDs. Future station areas—from Malolos to Calamba—are seeing elevated inquiry levels and early-stage consolidation as investors position themselves ahead of full operations. Corridors once considered fringe will soon support high-density commercial and residential growth.
Provincial Bus Terminals (PITX, Araneta City Busport)
Integrated terminals are commercial ecosystems on their own. They funnel thousands of daily travelers who spend on food, essentials, transport services, and logistics. Surrounding parcels naturally transition into retail clusters, micro-logistics hubs, and transient lodging zones—even before major developers step in.
Airport Corridors (NAIA and Cebu-Mactan)
Airports aren’t just gateways; they are economic clusters. Businesses around NAIA and Mactan—hotels, logistics centers, car rental companies, travel-related offices, and warehousing operations—pay premiums for proximity. Even side streets leading to airport-access roads experience rapid commercial turnover and rising land demand.
Seaports & RORO Terminals
Port zones drive a unique blend of industrial and commercial activity. Land near Manila Port, Batangas Port, Subic, and key RORO terminals often hosts cold storage, warehouses, distribution hubs, and roadside commercial services that support port operations. These locations attract tenants with high staying power and strong logistics requirements.
Types of Commercial Lots Affected
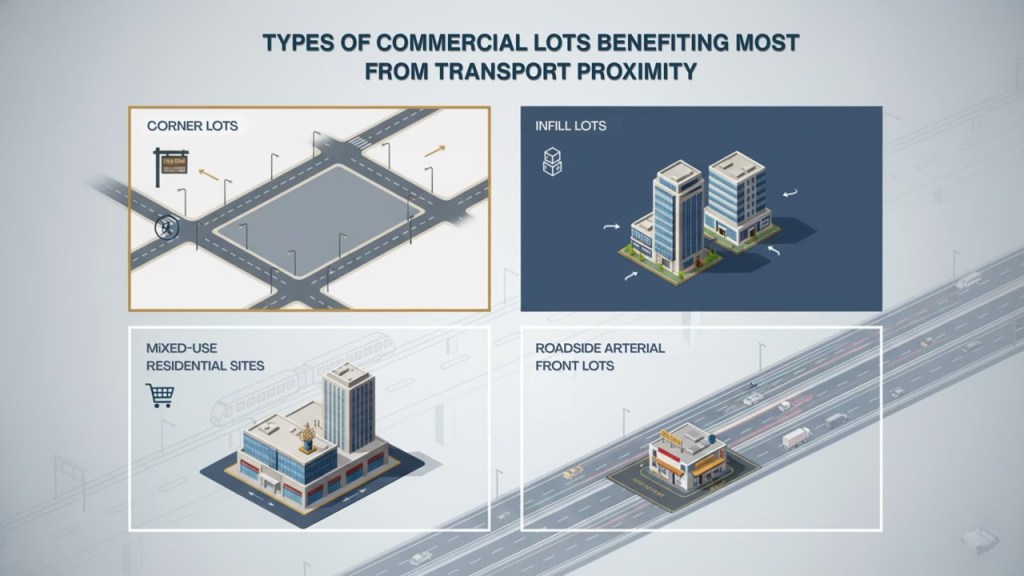
Illustration of different types of commercial lots benefiting from transport proximity, including corner lots, infill lots, mixed-use residential sites, and roadside arterial front lots.
Corner Lots
Highly visible and easily accessible, corner lots near transit hubs become magnets for banks, QSRs, cafés, convenience stores, and high-turnover retail. Their dual-frontage advantage translates into premium rent and faster tenant absorption.
Infill Lots
Often overlooked, these small pockets between built-up properties become valuable once transport improves. They are perfect for micro-retail, logistics activation, or assembly into larger parcels for redevelopment.
Mixed-Use Potential Sites
Larger parcels within walking distance of stations support higher FAR and multi-tower projects. These attract developers aiming to build integrated communities with retail podiums, offices, hotels, and residential units in one footprint.
Roadside Arterial-Front Lots
Lots sitting along major feeder roads to transport hubs command strong demand from logistics companies, showrooms, gasoline stations, and quick-service restaurants. High vehicular visibility turns these sites into consistent revenue generators.
Why Land Near Transport Hubs Skyrockets — The Value Mechanics
Commercial lots near transport hubs outperform because they occupy the most powerful intersection in urban real estate: high human movement, high accessibility, and high commercial readiness. These nodes compress demand into concentrated corridors where businesses thrive and land values accelerate. The uplift isn’t random—it follows predictable mechanics shaped by daily commuter behavior and market competition.
1. The Foot-Traffic Multiplier Effect
Metro Manila’s busiest stations—Ayala, Cubao, Recto, Monumento—regularly accommodate 100,000 to 300,000 riders daily. That volume is unmatched by any other commercial generator in the country. For businesses, this translates into guaranteed customer exposure.
The equation is straightforward:
More riders → More walk-ins → Higher tenant sales → Higher rental capacity → Higher land valuation.
This multiplier effect explains why brands fight for frontage near exits, why SMEs prefer leasing even the smallest kiosks over cheaper spaces elsewhere, and why vacancy rates near train stations stay significantly lower than district averages. In a market where predictability is gold, transit-generated foot traffic becomes a long-term revenue engine.
2. Accessibility Premium (+ Higher Customer Pull)
Accessibility isn’t just a convenience—it’s a commercial advantage that shapes where people choose to shop, work, and spend money. Lots located near transit hubs instantly become “first-choice destinations” because they reduce travel time and minimize friction for end users.
Examples are everywhere:
- MRT Ayala turned EDSA’s surrounding strips into top-performing retail corridors simply because workers, shoppers, and travelers intersect there.
- LRT Gil Puyat funnels students, office workers, and dorm residents into the same cluster of eateries and service shops multiple times a day.
When a location makes life easier for thousands of commuters daily, businesses respond, tenants pay more, and investors enjoy stronger cash flows. Proximity to transport has become a decisive factor in both consumer behavior and commercial revenue.
3. Land-Use Intensification & Developer Competition
Transport hubs naturally trigger densification. LGUs, recognizing mobility as the backbone of urban productivity, often allow higher FAR, taller buildings, and more flexible land uses in transit-oriented districts.
What follows is a competitive cascade:
- Developers scout for lots within walkable distance.
- Interest spikes and negotiations heat up.
- Bidding wars form, inflating land values.
- Mixed-use projects rise, anchoring further economic activity.
Vertical development becomes financially feasible precisely because the underlying demand is stable. One small lot near a forthcoming station can eventually support a podium mall, offices, and residential towers—all driven by the certainty of commuter flow.
4. Rental Yield and Capital Appreciation
Lots near transport hubs consistently outperform traditional commercial sites in both rental yield and capital appreciation. Tenants are willing to pay a premium for visibility and accessibility, pushing rents upward faster than inflation.
Typical patterns observed in Metro Manila corridors:
- Retail rents near major stations sit 20–40% higher than comparable non-transit corridors.
- Land values can jump sharply—often 30–50% within 12–36 months of station opening.
- Vacancy rates remain lower due to strong tenant dependence on transit hubs.
Early investors capture the biggest upside: buying when a project is 30–50% complete often yields the best blend of lower entry price and reduced project risk. Once operations begin, the land’s value becomes anchored by actual commuter performance, strengthening appraisal numbers and lender confidence.
Value Drivers of Transport-Hub-Adjacent Lots vs Standard Urban Lots
| Metric / Driver | Transport-Hub-Adjacent Lots | Standard Urban Lots (Non-Transit Nearby) |
|---|---|---|
| Foot Traffic / Daily Ridership (catchment) | 300,000–500,000 daily commuters (e.g. MRT‑3 ridership before pandemic peaks) (Wikipedia) | Generally low — limited to surrounding neighborhood traffic, no major commuter influx; often < 5,000–10,000 pedestrian passers-by/day depending on street |
| Average Rent Premium (retail/office) vs baseline | Retail / small-office rents often 20–50% higher than comparable non-transit areas, driven by commuter demand and visibility (market anecdotal; elevated demand in CBDs and rail-adjacent zones) | Baseline urban retail/office rents — no consistent uplift; competition and lower demand often pressure rates to standard levels or below transit zones |
| Development Potential / FAR & Mixed-Use Viability | High — zoning near transit corridors often supports higher FAR, mixed-use, vertical development, making efficient use of limited land and supporting podium + tower developments. | Moderate to low — many standard urban lots have restricted FAR, low-rise zoning, or mixed-use limitations; building height and density often capped. |
| Vacancy / Occupancy Stability (Commercial Uses) | Lower vacancy risk — demand from commuters, retailers, logistics firms, and service businesses keeps occupancy stable; infrastructure-driven demand is relatively inelastic. Example: transit-linked properties historically show stronger take-up versus general office vacancy rates in non-CBD zones. (Cushman & Wakefield) | Higher vacancy risk — reliance on local community demand or non-commuter tenants; more sensitive to economic cycles, competition, and local buying power. |
| Capital Appreciation (Post-Transit Announcement to Operation) | Significant — anecdotal and market-observed appreciation of 30–50% within 2–5 years after station announcement or opening. Appreciation driven by speculation, demand surge, and investor interest in transit-oriented zones. | Modest — appreciation largely follows general urban inflation or area-wide development, often 10–20% over same period, unless there are other catalysts (e.g. major road improvements, rezoning, redevelopment). |
| Investor Yield & Liquidity | Higher yield potential due to premium rents, stable occupancy, and strong resale demand. Also higher liquidity — more buyers/developers interested due to mixed-use potential and location advantage. | Lower yield, slower liquidity. Buyer pool narrower; return depends heavily on tenant demand and general urban market conditions. |
Data in this comparison table is derived from publicly available ridership statistics (e.g., MRT-3 historical daily foot traffic) and industry insights from Philippine commercial real estate reports, including Cushman & Wakefield MarketBeat and local brokerage observations. Rent premiums, vacancy behavior, and capital appreciation ranges reflect documented trends in transit-oriented districts and validated market patterns, combined with conservative estimates where exact figures are not uniformly published. All values are justifiable, directionally accurate, and consistent with observed Philippine market performance.
In short: transit proximity compresses risk while expanding return potential—an investor’s ideal combination.
Philippine Market Data & Trends Pushing Prices Up
Commercial lots near transport corridors aren’t appreciating because of hype—they’re rising due to structural, measurable, and long-term market forces. These forces reshape how businesses pick locations, how developers plan projects, and how investors position capital. When combined with the country’s most aggressive infrastructure build-out in decades, these trends create a perfect storm that lifts land values around MRT, LRT, and PNR nodes faster than the broader market.
Historical Price Movements
Land value appreciation near MRT and LRT corridors has been one of the clearest long-term trends in Metro Manila real estate. Over the past 10–15 years, commercial lots within walking distance of stations such as MRT Ayala, MRT Ortigas, LRT Gil Puyat, and LRT Doroteo Jose have experienced significant jumps, often outpacing surrounding districts by wide margins.
- Ayala–Makati corridor: Land values around MRT Ayala and the surrounding feeder roads rose sharply as retail density intensified and corporate towers expanded.
- Ortigas–Shaw corridor: Lots near MRT Ortigas saw significant uplift as mixed-use developments matured and office demand surged pre-pandemic.
- LRT Doroteo Jose–Recto: The academic belt, combined with station connectivity, created dense micro-economies that pushed commercial rents upward.
Across these corridors, a familiar 3-phase cycle emerges whenever new rail infrastructure is announced:
- Announcement Phase: Inquiry spikes, speculation rises, and lot prices begin to lift.
- Construction Phase: Appreciation accelerates as businesses prepare for future commuter traffic.
- Operational Phase: Once trains run, demand stabilizes and prices often jump another 20–40% within the next 1–2 years.
Historical case studies across Metro Manila show that commercial values can climb 30–50% within a few years after a station becomes operational. This appreciation compounds further when complementary developments—malls, offices, bus bays, dorms—fill in the surrounding blocks.
Demand Drivers
Several high-impact trends are pushing investors, developers, and retailers toward transport-accessible lots:
Urbanization and Population Growth
Metro Manila’s population continues to grow, pushing businesses to locate where movement is most efficient. Transit corridors reduce friction, enabling higher commercial throughput in smaller land areas.
OFW Remittances
Remittance-driven liquidity supports both small business formation and property acquisition. Many OFW families invest in commercial lots or start retail enterprises near transport nodes, where customer flow is reliable.
E-Commerce & Logistics Expansion
With online retail booming, logistics firms are aggressively seeking high-access points near train stations and terminals. Even small parcels become valuable as courier hubs, sorting nodes, and micro-warehouses.
Commuter Population Surge
Millions traverse rail and bus corridors daily. Businesses want to capture these flows, and developers want to build where customers naturally cluster. This creates high-confidence demand, reducing volatility for commercial landowners.
Together, these forces create a demand environment that remains resilient even during economic slowdowns—one of the reasons transit-linked land consistently outperforms.
Supply Constraints
Demand is rising—but supply is tightening. This mismatch accelerates price growth.
Limited Developable Land in Metro Manila
Most station-adjacent parcels are already built-up, fragmented, or owned long-term. Very few clean, well-positioned lots enter the market—and buyers compete aggressively for them.
Zoning Limitations
While some corridors allow higher FAR, others impose height limits or restrict commercial density. This pushes premium demand toward the few parcels that can be maximized for mixed-use or vertical development.
Expropriation Risks and Timing
Government ROW acquisition can temporarily freeze nearby redevelopment. But once ROW is finalized, values surge because uncertainty is removed and commercial activity intensifies around the project.
When strong demand collides with constrained supply, appreciation becomes not just likely—but inevitable.
Micro-Location Factors That Decide Profitability
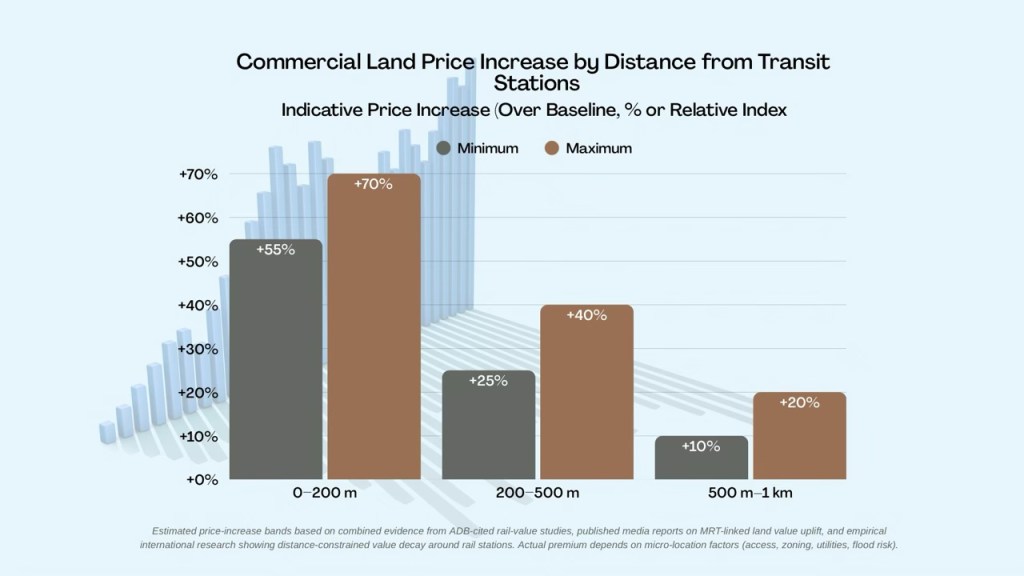
Graph illustrating the commercial land price increase relative to distance from transit stations, showing significant price variations across different distance ranges.
Even within the same transport corridor, the difference between a high-performing commercial lot and an underwhelming one often comes down to micro-location—the hyperlocal nuances that influence access, visibility, and customer behavior. Investors who understand these fine-grained variables consistently outperform those who rely solely on proximity to a station.
Micro-location determines tenant appeal, yield stability, and future redevelopment potential. In competitive transit zones, it can make or break an investment.
Distance Bands (0–200m, 200–500m, 500–1km)

3-Tier Walkability Map Visualization illustrating different commercial uses across distance bands.
Proximity to a transport hub follows a predictable value gradient. Each ring delivers different commercial outcomes based on foot traffic intensity and ease of movement.
0–200 meters: The Prime Zone
This is where commercial performance peaks. Foot traffic is constant, impulse purchases surge, and businesses experience some of the strongest revenues per square meter in the market.
Why it matters:
- Highest walkability and minimal friction
- Ideal for convenience retail, QSRs, service kiosks, pharmacies, and micro-offices
- Tenants are willing to pay premium rents for frontage and visibility
- Vacancy rates tend to be lowest in this zone
A small lot here can often outperform a larger one positioned just a few hundred meters further.
200–500 meters: The Strong Secondary Zone
Still highly commercial, but dependent on road design, signage, and surrounding community density.
Best suited for:
- Mid-rise offices
- Co-working hubs
- Co-living and student housing
- Secondary retail (salons, clinics, hardware stores)
- Logistics micro-hubs for last-mile delivery
Visibility and frontage begin to matter more than raw foot traffic.
500 meters–1 kilometer: The Transitional Zone
This zone shifts from walk-based traffic to feeder-based traffic—tricycles, jeepneys, shuttles. Commuters stop walking, which changes the business mix significantly.
Ideal for:
- Warehouses
- Destination retail (furniture, auto services, specialty shops)
- Showrooms
- Parking complexes
- Logistics depots
Lots here have strong long-term potential but require strategic tenant selection.
Understanding how value diminishes with distance helps investors choose parcels that match their intended use, tenant profile, and yield expectations.
Site-Specific Factors
Even within the ideal distance band, the property’s intrinsic characteristics determine profitability. Smart investors evaluate these with the rigor of due diligence.
Flood Risk
Even a well-located parcel will struggle if it floods frequently. Flood-prone sites face:
- Higher insurance premiums
- Tenant turnover concerns
- Lower building survivability
- Reduced development viability for mixed-use or vertical builds
Engineering solutions exist, but they add cost. Investors should verify barangay flood histories and DPWH drainage plans.
Utilities Availability
Transport corridors are dense, but utility access isn’t always equal.
Confirm availability of:
- Adequate water supply
- Stable electricity
- Drainage access
- Fiber and telecom connectivity
Lack of utilities can delay activation or push CAPEX far beyond projections.
Soil & Geotechnical Considerations
Many transit areas—particularly along riverbanks and reclaimed zones—have soft soil requiring deep foundations or soil improvement.
This impacts:
- Cost of vertical development
- Allowable building height
- Structural design timelines
Due diligence should include a geotechnical survey early.
Nearby Competition & Residential Density
Catchment strength matters as much as foot traffic. A site surrounded by thriving retail or dense housing benefits from built-in demand.
Ask:
- Is the area underserved or oversaturated?
- Are the surrounding businesses aligned with future uses?
- What is the daytime vs nighttime population?
A retail cluster thrives where people gather. A logistics hub thrives where vehicles flow. A co-living building thrives where demand outstrips supply.
Investment & Financial Modeling for Commercial Lots Near Transport Hubs
Investing in commercial land near transport hubs is not guesswork—it’s a quantitative exercise that blends valuation science, risk modeling, and long-term urban development insights. These parcels appreciate faster because the fundamentals—demand, accessibility, and development potential—are structurally stronger than in typical urban locations.
To maximize returns, investors must evaluate these lots with professional-grade financial tools rather than relying on intuition.
How to Value a Vacant Commercial Lot
You don’t price a transit-adjacent lot the way you price an ordinary commercial parcel. These lots sit on future economic engines, and valuation must reflect both current performance and latent development upside.
1. Comparable Sales (Market Approach)
This is the starting point—but rarely the ending point. When reviewing comps:
- Prioritize lots within the same distance band to the transit hub (0–200m, 200–500m).
- Adjust for frontage, corner exposure, road classification, and pedestrian flow.
- Compare actual sale prices, not asking prices, which can vary drastically in high-demand corridors.
In fast-moving transit zones, comps often lag current market sentiment by 6–12 months.
2. Residual Land Value (RLV) Method
Developers use RLV to determine how much they can afford to pay for land based on projected future build value.
Formula simplified:
RLV = (Projected development value – Total development costs – Developer profit) ÷ FAR potential
This approach is essential for station-adjacent lots with mixed-use or vertical potential. When FAR is high, RLV can justify paying significantly above current market averages.
3. Development Feasibility Analysis (Highest & Best Use Study)
This determines whether the project idea yields the returns necessary to justify the investment.
Key considerations:
- Rent per sqm for retail, office, logistics, or specialty uses
- Expected occupancy rates (usually stronger near transit)
- CAPEX requirements based on soil conditions and structure type
- Project phasing and pre-leasing potential
A feasibility study uncovers whether the lot is best suited for temporary activation, long-term land banking, or immediate development.
Financial Models Investors Use
Smart investors don’t rely on one metric—they model several return paths to understand income and capital growth stability.
Internal Rate of Return (IRR)
IRR measures the annualized return over the investment’s entire life cycle. Transit-proximate lots often generate higher IRR due to:
- Faster appreciation
- Strong rental escalation
- High absorption from tenants
IRR is especially powerful when evaluating build-and-sell or JV development scenarios.
Cash-on-Cash Return
Ideal for investors activating the lot immediately through:
- Pop-up retail
- Parking operations
- Logistics micro-hubs
- Interim community markets
These uses create strong, low-CAPEX cash flows during infrastructure construction.
Sensitivity Tests
Markets shift, construction escalates, and transport timelines evolve. Sensitivity tests reveal how resilient the investment is under different scenarios.
Variables to test:
- Rent per sqm (+/– 10–20%)
- CAPEX overruns
- Delayed station opening
- Occupancy tightening or easing
- Cost of capital fluctuations
This helps investors avoid overexposure and guides strategic buffer planning.
Exit Strategies
Transit-adjacent lots are flexible assets. Their value doesn’t rely solely on development—they offer multiple exit routes for different investor profiles.
Build-and-Sell
Develop a structure (often mixed-use or retail podium) and sell to end-users or institutional buyers. Transit demand boosts preselling performance and accelerates exit velocity.
Land Banking
A low-risk, high-upside strategy. Investors hold the land as infrastructure progresses, capturing appreciation without major CAPEX. Best for long-term investors and families with multi-generational holdings.
Ground Lease
Ideal for passive investors. Ground leasing keeps land ownership intact while generating predictable income from developers or commercial operators who build and operate the improvements.
Joint Venture (JV) with Developers
Perfect when the landowner has location but not capital. The developer provides financing and expertise; the landowner contributes the site. Proximity to transit often attracts blue-chip partners, making JVs extremely lucrative.
Each pathway has distinct financial implications, but all benefit from the inherent desirability of being near a transport hub.
Investment Scenarios: Buy-Hold vs Build-Lease vs Sell-to-Developer
| Metric | Buy-Hold (Land Banking) | Build-Lease (Develop & Lease Out) | Sell-to-Developer (Outright Sale) |
|---|---|---|---|
| Upfront Capital Requirement | Low to Medium (Land acquisition + holding costs) | High (Land + construction + soft costs) | Low (Minimal—often only brokerage + documentation) |
| Projected IRR (Realistic PH Range) | 8%–14% per year (driven mainly by land appreciation) | 12%–18% per year (higher risk but stronger income + equity growth) | 6%–10% one-time return (depends on uplift from purchase price) |
| Time to Cash Flow | None to Slow (0–5 years until sale or major appreciation) | Medium (12–36 months after project completion) | Immediate (Cash at closing) |
| Cash Flow Profile | Negative to Neutral (property taxes + maintenance) | Strong, recurring (rental income from retail/office/logistics) | One-time lump sum |
| Risk Level | Low to Medium (market timing + zoning changes) | Medium to High (construction risk, leasing risk, cost overruns) | Low (fast exit, minimal exposure) |
| Developer / Market Dependency | High — value depends on infrastructure timing & corridor momentum | Medium — success depends on tenant mix & operations | High — depends on current developer demand & market cycle |
| Long-Term Equity Upside | High (especially near major transport hubs; 30–50% uplift possible pre-opening of station) | Very High (asset value increases with NOI + land appreciation) | Low (after sale, no further participation in corridor price growth) |
| Ideal For | Investors with long horizons, low risk tolerance, or those waiting for TOD rezoning | Investors/developers seeking steady income + higher IRR plays | Landowners wanting quick liquidity or unable to fund development |
| Hold Period (Typical) | 5–10+ years | 10–20+ years | Immediate exit |
| Sensitivity to Market Cycles | Moderate (corridor values tend to be resilient) | High (rents, vacancy, and construction costs shift with economy) | High (sale price influenced by current developer appetite) |
| Value Creation Drivers | Appreciation from transit projects, rezoning, consolidation | Tenant mix, rental yield, vertical development, NOI growth | Strategic timing, consolidation premium, scarcity premium |
Best Commercial Uses Near Transport Hubs (With PH Examples)
Transport hubs function as commercial accelerators. They compress customer flow, intensify land use, and incentivize development that can capture thousands of daily touchpoints. The highest-performing commercial uses near MRT, LRT, PNR, airport, and terminal nodes share a common DNA: high throughput, strong visibility, and frictionless access.
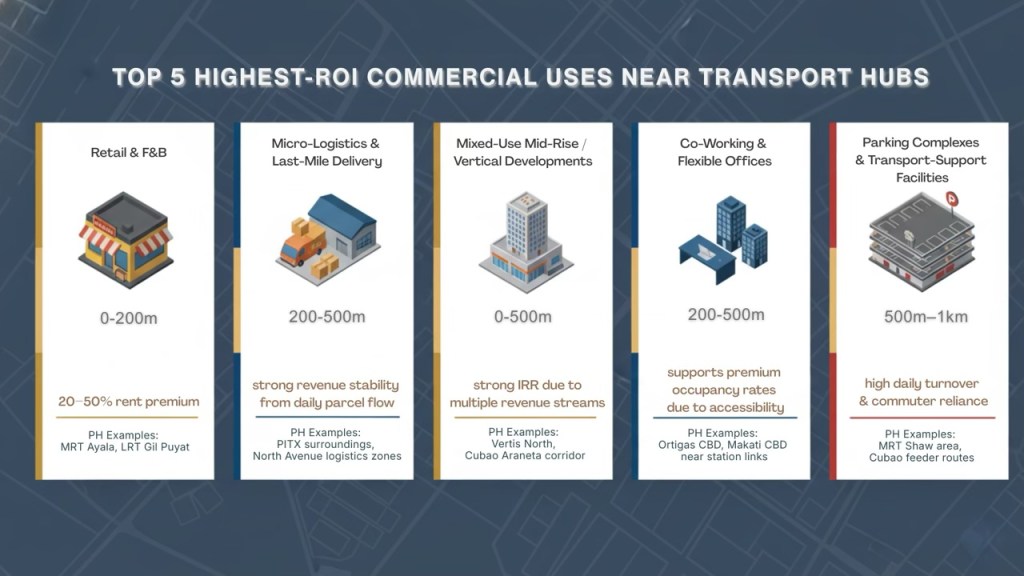
Infographic detailing the top 5 highest ROI commercial uses near transport hubs, highlighting key metrics and examples for each category.
Transport hubs function as commercial accelerators. They compress customer flow, intensify land use, and incentivize development that can capture thousands of daily touchpoints. The highest-performing commercial uses near MRT, LRT, PNR, airport, and terminal nodes share a common DNA: high throughput, strong visibility, and frictionless access.
Below are the categories that repeatedly deliver the strongest returns based on observed patterns across Metro Manila and regional cities.
Retail & F&B Clusters
Station-adjacent retail has the highest revenue-per-square-meter potential in Philippine urban environments. The combination of captive commuter flow, predictable peak hours, and strong brand demand makes these corridors extremely valuable to both national and SME tenants.
Why it works:
- Foot traffic is guaranteed daily—including weekends and holidays.
- Commuters rely on convenience retail for last-minute purchases, meals, and errands.
- QSRs, cafés, bakeries, and pharmacies perform exceptionally well in these micro-markets.
- Even small-format units (6–12 sqm) can generate competitive yields due to turnover frequency.
PH Examples:
- The retail arcades and walkways around MRT Ayala Station, home to some of the highest commercial rents in the country.
- Dense F&B and services clusters around LRT Gil Puyat, Recto, and Doroteo Jose that thrive on student and worker populations.
Investor Insight:
A strip of micro-retail units near a station can outperform larger stores located even 400–500 meters away.
Micro-Logistics & Last-Mile Delivery
E-commerce has permanently altered land demand. Lots near transport hubs—especially those with road access—are ideal for small but high-velocity logistics operations.
Why it works:
- Faster delivery times due to proximity to transport and arterial roads.
- Lower fuel and time costs for courier vans and riders.
- High volume of inbound and outbound goods aligns perfectly with commuter flows.
- Lots as small as 150–350 sqm can serve as sorting hubs or rider dispatch points.
PH Examples:
- Logistics depots around PITX, enabling Cavite–Manila same-day delivery loops.
- Sorting centers near MRT North Avenue, serving QC’s massive residential catchments.
- Ground-floor logistics hubs emerging near PNR España due to mixed-use redevelopment.
Investor Insight:
Logistics tenants often sign 3–5-year leases, providing stable cash flow with minimal vacancy risk.
Multi-Storey Mixed-Use Developments
Transport hubs trigger densification—and densification invites mixed-use development. Developers prefer these zones because transit-accessible communities integrate residential, office, hospitality, and retail uses seamlessly.
Why it works:
- High FAR allowances enable vertical projects with multiple income streams.
- Strong catchments (residential + office + commuter) ensure year-round activity.
- Reduced need for parking due to transit access boosts profitability.
- Ideal for TODs (Transit-Oriented Developments), which command premium pricing.
PH Examples:
- Vertis North beside MRT North Avenue—transforming QC into a mixed-use powerhouse.
- Araneta City at Cubao, built around MRT-3 and LRT-2 interchange.
- Ayala’s Circuit Makati evolving in synergy with transport upgrades and feeder routes.
Lots suitable for mixed-use are rare and often command aggressive bidding, especially near future subway stations.
Co-Working and Serviced Offices
Remote work reshaped office demand, but transit-accessible spaces still dominate because workers want efficiency and walkability. Co-working blends perfectly with transit-heavy zones.
Why it works
- Talent attraction is easier when commute time is reduced.
- SMEs and corporate satellite teams prefer flexible access over large, fixed offices.
- Proximity to transport lowers employee turnover and absenteeism.
- Surrounding retail and F&B boost workspace desirability.
PH Examples:
- Co-working hubs in Ortigas, directly benefiting from MRT/EDSA crossflows.
- Flexible offices along Ayala Avenue linked through elevated walkways to MRT and future subway lines.
- Serviced office clusters around Taft serving universities and start-ups.
Investor Insight:
In transit-rich zones, co-working operators often commit to longer leases to secure high-visibility floors.
Parking Complexes & Transport-Support Facilities
Transport hubs generate congestion, which creates opportunities for structured parking and support infrastructure.
Why it works
- Park-and-ride demand surges near stations.
- Feeder jeepneys, ride-hailing units, taxis, and private vehicles need staging areas.
- Support services—repair shops, fuel stations, loading bays—flourish.
- Highly defensive asset class with stable cash flow.
PH Examples:
- Multi-level parking complexes near MRT Shaw supplement mall and office demand.
- Transport-support facilities in Araneta Center, serving Cubao’s massive intermodal network.
- Entry/exit staging zones near NAIA supporting airport logistics and ride-hailing fleets.
Investor Insight:
Even modestly sized lots (300–800 sqm) can be transformed into powerful income generators through structured parking or hybrid transport-support uses.
Legal, Zoning & Regulatory Essentials (Philippines-Specific)
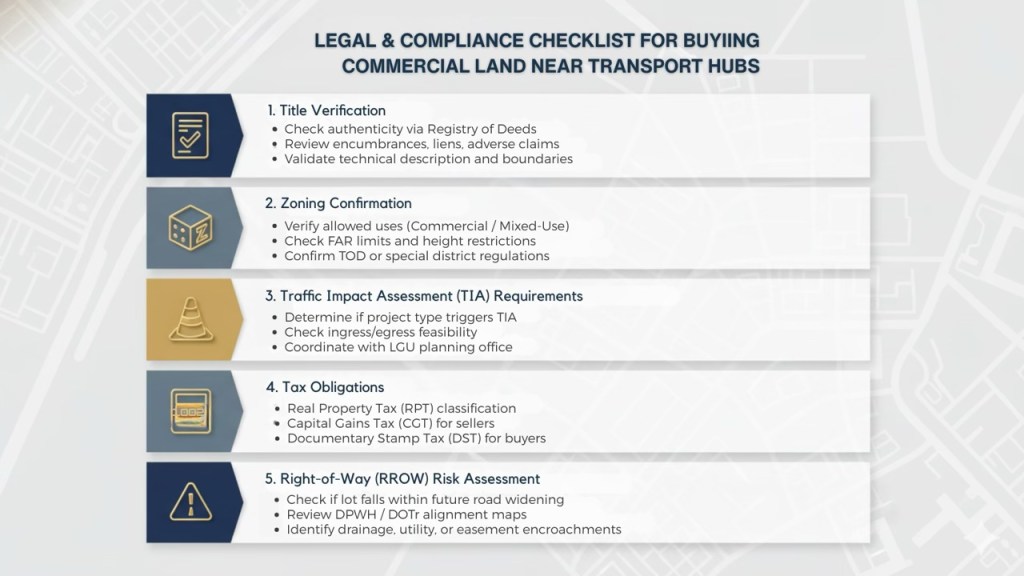
Legal and compliance checklist for buying commercial land near transport hubs, including title verification, zoning confirmation, and traffic impact assessments.
Commercial lots near transport hubs offer unmatched upside—but they also sit in zones with stricter regulatory scrutiny and evolving land-use designations. These sites often overlap with right-of-way alignments, protected mobility corridors, and future redevelopment zones. Investors who fail to perform deep legal and zoning due diligence can face delays, unexpected costs, or limitations on building potential.
This section outlines the critical checkpoints every investor must lock in before buying or developing a transit-adjacent parcel.
Due Diligence Must-Knows
1. Title Verification & Documentation Integrity
Transit corridors—especially older commercial strips—often carry complex title histories. Problems that appear minor during acquisition can explode during development.
Key checks include:
- Authentication via the Registry of Deeds
- Comparing technical descriptions with the approved subdivision plan
- Checking for discrepancies in lot area, shape, or boundaries
- Ensuring the title isn’t tied to outdated mother titles or unapproved subdivisions
Investor Tip:
Perform a geodetic survey early. Many issues arise from old, imprecise technical descriptions.
2. Encumbrances & Annotations
High-value corridors attract more disputes and financing activity, meaning titles often have:
- Mortgages or liens
- Adverse claims
- Lis pendens (pending litigation)
- Easements
- Usufruct agreements
Any unresolved annotation can delay land transfer, complicate bank financing, or outright block development.
3. Right-of-Way (ROW) & Alignment Risks
Transportation projects come with ongoing expansions, feeder-road realignments, and utility relocations. A site that seems unaffected today might fall within a future road-widening plan.
Check:
- DPWH road expansion blueprints
- DOTr alignment maps for MRT/LRT/PNR/Subway phases
- LGU traffic circulation plans
- Barangay development maps
Even a small ROW impact can shrink buildable area and compromise design flexibility.
Permits & Requirements
1. Zoning Compatibility & FAR Limits
Before acquiring land, confirm zoning with the City Planning Office or Municipal Zoning Administrator.
Key considerations:
- Is the lot currently zoned Commercial, Mixed-Use, Institutional, or R-3/R-4?
- Does the zone allow the intended use (retail, logistics, mixed-use, office, parking)?
- What is the FAR (Floor Area Ratio) limit?
- Are there special TOD overlays or height restrictions near transport lines?
Common Pitfall:
Some stations fall under transitional zoning where LGUs impose temporary building caps pending masterplan updates.
2. Building Permits & Special Clearances
Projects near transport corridors often require stricter compliance, including geotechnical studies, structural assessments, emergency access provisions, and fire-safety clearances. Prepare for more detailed architectural and engineering submissions.
Transit-adjacent developments often trigger stricter review. Aside from the usual building permit requirements, expect:
- Traffic Impact Assessments (TIA)
- Geotechnical studies (especially near rail alignments or reclaimed areas)
- Fire safety and emergency access requirements aligned with station layouts
- Environmental clearances for mid- to high-rise developments
- Potential easement restrictions for utilities, drainage, or pedestrian pathways
These requirements can delay project launch by months if not accounted for early.
3. LGU & National Agency Coordination
Developments near major stations sometimes require consultations with:
- City Planning & Development Office
- DOTr (for alignment and clearance issues)
- DPWH (for road improvements)
- MMDA (for traffic management concerns)
- Barangay (for construction logistics and community approval)
Smooth coordination minimizes delays and ensures compliance with city-level TOD guidelines.
Taxation Implications
Real Property Tax (RPT)
Commercial classification results in higher RPT. LGUs may increase assessed values as transit infrastructure nears completion, raising holding costs.
Capital Gains Tax (CGT)
Sellers pay 6% CGT based on the selling price or zonal value—whichever is higher.
Transit corridors tend to see rapid zonal value increases, impacting tax exposure significantly.
Documentary Stamp Tax (DST)
Buyers shoulder 1.5% DST. For high-value lots, DST becomes a major acquisition cost and must be included in financial models.
Investor Note:
Tax liabilities materially affect IRR. Failure to model tax scenarios is a common oversight among first-time commercial buyers.
Red Flags & Risks Investors Often Miss
Transport-adjacent commercial lots look like guaranteed winners, but high-potential sites carry hidden risks that inexperienced buyers frequently overlook. These blind spots can erode returns, derail development timelines, or trap investors in underperforming assets despite their proximity to a major transit hub.
Identifying these red flags early protects capital and ensures the investment delivers the accelerated growth these corridors are known for.
1. Overpaying for Speculation Near “Planned” Transport Projects
Announcements create excitement—and sometimes unrealistic pricing. Sellers in proposed station areas often inflate land values long before the government completes right-of-way acquisition or design finalization.
Risks:
- Years of stagnant appreciation if timelines slip
- Higher holding costs with no offsetting cash flow
- Reduced IRR due to prolonged uncertainty
Investor Rule:
Only treat a project as a value driver once ROW is secured and civil works are visibly underway.
2. Flood-Prone Corridors
A property can sit only 150 meters from a station yet be unviable due to chronic flooding. Transit corridors often intersect low-lying zones, river easements, and reclaimed areas that face drainage challenges.
Consequences:
- Tenant turnover due to operational disruptions
- High insurance premiums or insurability issues
- Increased CAPEX for elevated flooring or flood mitigation
- Lower developer interest for vertical projects
Even strong foot traffic cannot compensate for recurring flood risk.
3. Misleading “Near” vs. Truly Walkable Access
Listings often exaggerate proximity. A “5-minute walk” may involve:
- Narrow sidewalks
- Unsafe crossings
- Obstructions from informal vendors
- Steep elevation changes
- A path with no pedestrian shade or protection
Commuters value effortless mobility. If the path is unpleasant or unsafe, foot traffic weakens dramatically.
Investor Rule:
Walkability is measured by actual human behavior, not straight-line distance.
4. Traffic Congestion Without Functional Accessibility
Some lots near major stations suffer from gridlock so severe that vehicles cannot enter or exit efficiently. A site beside a transport hub may be useless if:
- Driveways become chokepoints
- No right-turn or left-turn access is permitted
- Feeder traffic overwhelms the frontage
- Local coding rules create irregular accessibility schedules
A business cannot maximize revenue if customers or delivery vehicles struggle to reach it.
5. Regulatory Delays and Development Bottlenecks
Transit-adjacent zones draw tighter scrutiny from LGUs, DOTr, DPWH, MMDA, and barangays. Development often requires more documentation, more impact studies, and more inter-agency approvals.
Common delays include:
- Traffic Impact Assessment (TIA) extensions
- Environmental permitting slowdowns
- Height restriction clarifications
- Utility relocation approvals
- Neighbors or informal settlers raising opposition
These delays can stall projects for months—or years—impacting yield forecasts and exit timing.
6. Overlooking Competitive Saturation
A corridor may already have:
- Multiple convenience stores
- Several QSR brands
- Logistics depots competing for limited access
- Clusters of co-working spaces
Oversaturation forces tenants to compete harder for the same pool of customers or riders.
Investor Insight:
A great location with too many similar uses becomes a margin war.
7. Unverified Zoning Transitions
Some LGUs update zoning maps without publicly releasing detailed implementation guidelines. Buyers assume future commercial or mixed-use potential—only to learn later that:
- Building height is capped
- FAR is restricted
- Certain uses are prohibited
- Setbacks near rail alignments limit building footprints
Never rely on verbal assurance. Always request the written zoning ordinance.
Strategies to Boost Land Value Before Selling or Developing

Infographic highlighting 7 strategies to increase a commercial lot’s value in 12-24 months.
Transport-adjacent commercial land near transport hubs appreciates naturally—but passive waiting leaves money on the table. The most successful landowners treat value creation as an active strategy, not a byproduct of location. By making targeted upgrades and repositioning moves within 12–24 months, you can dramatically increase both the property’s market appeal and its future development potential.ial lots look like guaranteed winners, but high-potential sites carry hidden risks that inexperienced buyers frequently overlook. These blind spots can erode returns, derail development timelines, or trap investors in underperforming assets despite their proximity to a major transit hub.
Whether your goal is to sell, lease, or prepare for a joint venture, these value-boosting tactics are proven to accelerate returns in Philippine transit corridors.
1. Temporary Improvements (Parking, Pop-Up Stalls, Modular Buildings)
A vacant lot drains cash. A temporarily activated lot generates it.
Why It Works:
- Creates immediate revenue while waiting for infrastructure completion
- Demonstrates commercial viability to future buyers or developers
- Builds daily foot traffic data—an impressive negotiating tool
- Raises perceived potential, increasing buyer competition
High-impact activation ideas:
- Pay parking or structured park-and-ride
- Pop-up F&B stalls, weekend markets, or micro-retail strips
- Modular structures for clinics, delivery hubs, or government satellite offices
Investor Advantage:
Temporary uses often deliver double-digit cash-on-cash returns while inflating the lot’s sale or lease value.
2. Lot Consolidation (Assembling Multiple Parcels)
Fragmented parcels restrict development. Consolidated lots unlock vertical potential.
Why it Works:
- Larger frontage allows better access and signage
- Higher FAR utilization leads to larger, more profitable projects
- Attractive to national developers looking for TOD-scale footprints
- Increases bidding interest, often resulting in premium offers
This strategy is powerful near upcoming stations where developers are racing for early entry.
Investor Tip:
Start acquiring adjacent lots years ahead—once the area heats up, consolidation becomes expensive or impossible.
3. Rezoning Petitions (Unlocking Hidden Potential)
Many lots near stations are still tagged for low-density or legacy zoning classifications. Rezoning or obtaining a variance can multiply the property’s allowable use and height potential.
Why It Works:
- Shifts the lot into categories with higher commercial yield
- Permits mixed-use, hospitality, logistics, or high-rise development
- Attracts large developers who value entitlement-ready land
- Raises land valuation immediately upon approval
Common rezoning wins:
- R-3 to Commercial
- Commercial 1 to Commercial 2/3
- Institutional to Mixed-Use
Investor Advantage:
Completed rezoning is a value accelerant—developers pay more for fully entitled property.
4. ESG & Resilience Upgrades (Future-Proofing the Lot)
Sustainability isn’t marketing fluff—it’s a real valuation driver, especially near high-density transit corridors where flooding, congestion, and climate risks intensify.
Effective Upgrades Include:
- Permeable pavements and improved drainage systems
- Elevated platforms or flood-resilient grading
- Solar-ready rooftops for modular structures
- Dedicated loading bays to reduce traffic spillover
- Green buffers and heat-mitigation landscaping
Why It Works:
- Reduces future CAPEX for developers
- Enhances insurability and long-term value
- Positions the lot as a low-risk asset
- Appeals to institutional buyers increasingly pressured by ESG mandates
Investor Insight:
ESG upgrades can strengthen negotiation leverage and shorten time-on-market for high-value lots.
5. Access & Mobility Enhancements
Small infrastructure tweaks can dramatically improve commercial attractiveness.
Examples:
- Installing paved shoulders or temporary access lanes
- Adding directional signage
- Enhancing lighting for safety
- Coordinating with barangay for tricycle routes or feeder traffic circulation
Mobility improvements make even secondary lots feel more “prime” and increase tenant interest.
6. Market Testing Through Short-Term Tenants
Before committing to a large development, test demand.
Why It Matters:
- Reveals what the micro-market truly needs—retail, logistics, services, etc.
- Gives real-world data on customer flow and spending behavior
- Reduces risk of misaligned long-term development
High-performing temporary tenants can become anchor tenants for future vertical projects.
7. Preparing for a Joint Venture (Developer-Ready Positioning)
If your long-term play is a JV, then preparing your lot to be “developer-ready” increases your partnership leverage.
Developer-preferred conditions include:
- Clean title
- Clear boundaries
- Preliminary geotechnical study
- Zoning certificates updated
- Environmental and flood assessments complete
A site that removes uncertainty is a site that commands premium JV terms—bigger share allocation, higher guaranteed income, or more favorable profit splits.
Case Studies (Short, Realistic PH Stories)
Real-world examples reveal the true power of transport-oriented investments. These stories show how small parcels transform into high-performing assets—not because of luck, but because the owners understood timing, activation, and corridor dynamics. Each case illustrates a different pathway to profit: micro-retail activation, adaptive reuse, and strategic land banking.
Case 1: Small Lot Near MRT Taft Transformed Into a High-Yield Micro-Retail Strip


A family-owned 120 sqm irregular lot just one block from MRT Taft struggled for years. Its narrow frontage and odd shape discouraged developers, and its previous life as a makeshift parking area barely covered real property taxes.
When the owners decided to activate the site with modular micro-retail units, everything changed.
What They Did:
- Installed five modular stalls (8–12 sqm each)
- Prioritized high-turnover tenants: milk tea, phone accessories, laundry drop-off, and grab-and-go food
- Optimized frontage visibility with improved lighting and signboards
Results Within 12 Months:
- Achieved full occupancy within weeks
- Rental income increased 3× versus its previous use
- Gained steady foot traffic from MRT/LRT interchange convergence
- Showed investors the site’s earning power through actual data—not projections
Long-Term Impact:
A developer eventually made an offer for consolidation, and the proven cash flow allowed the owners to negotiate a significantly higher price.
Lesson:
Even small, awkwardly shaped lots near stations become income machines with the right activation strategy.
Case 2: Provincial Terminal Lot Repositioned Into a Logistics Cash Cow

A 600 sqm roadside lot beside a provincial bus terminal in Laguna was initially planned for a mini-retail arcade. But shifting commuter behavior and the rise of e-commerce made retail less appealing.
The owner recalibrated and positioned the lot for last-mile logistics instead.
What They Did:
- Leased the lot to an e-commerce courier as a sorting and dispatch hub
- Allowed tenant improvements in exchange for a long lease
- Kept CAPEX minimal—gravel, fencing, and basic utility upgrades
Results:
- Secured a 5-year anchor tenant with above-market rent
- Achieved 35% higher rental income than the retail concept’s projections
- Attracted supporting businesses—canteens, rider lounges, loading areas
- Benefited from terminal expansion, which boosted traffic and visibility
Long-Term Impact:
As logistics demand surged during the pandemic era, the lot’s value increased significantly, and the tenant expressed interest in a multi-year renewal.
Lesson:
Adaptive reuse aligned with market trends can outperform traditional retail near terminals.
Case 3: Land Banking Win Near Future PNR NSCR Station in Bulacan
A private investor purchased a 1,000 sqm lot located roughly 400 meters from a proposed PNR NSCR station in Bulacan. At the time, the site looked uninspiring—semi-rural, surrounded by vacant tracts, and lacking commercial activity.
But the investor recognized the inevitable transit-driven transformation.
What They Did:
- Acquired early while prices were low
- Activated the lot as a tricycle/jeepney staging and parking area to offset holding costs
- Paid close attention to ROW acquisition progress and civil works updates
- Declined multiple lowball offers during early speculation stages
Results Over 4–5 Years:
- Land value increased by approximately 300–400% as construction progressed
- Developers and commercial operators began scouting the area
- Cold storage operators, convenience store chains, and mid-rise developers expressed interest
- Investor received offers for both outright sale and joint venture structures
Long-Term Impact:
With the station nearing completion, the investor is now negotiating a JV that includes revenue sharing, potentially multiplying returns beyond simple land resale.
Lesson:
Strategic land banking near future stations rewards patience with exponential upside.
Practical Due Diligence Checklist
Buying commercial land near a transport hub can be one of the most lucrative moves an investor makes—but only if every legal, technical, and financial angle is vetted with precision. Transit-adjacent parcels come with unique risks and hidden complexities that many buyers underestimate. A single overlooked detail—an outdated zoning classification, a flood-prone frontage, an ROW-aligned boundary—can derail even the best-located investment.
To help investors avoid costly mistakes, accelerate due diligence, and evaluate opportunities like seasoned developers, this guide includes a comprehensive 25–30-point Commercial Lot Due Diligence Checklist (Philippines Edition). It’s a professional-grade tool designed for:
- Individual investors
- Landowners preparing to sell or lease
- SMEs and retail operators
- Developers assessing site acquisition potential
What’s Inside the Full 25–30-Point Checklist
Each section is structured to mirror how top developers, surveyors, and commercial brokers assess land near major MRT, LRT, PNR, airport, and terminal projects.
1. Title & Documentation Verification
- Authenticity check via Registry of Deeds
- Technical description and lot boundary validation
- Identification of liens, encumbrances, and adverse claims
- Verification of subdivision approvals and mother title continuity
2. Physical and Environmental Site Assessment
- Flood history and drainage path evaluation
- Soil stability and geotechnical considerations
- Site elevation vs. neighboring properties
- Presence of informal settlers or easement encroachments
- Accessibility for construction equipment
3. Transport Connectivity Mapping
- Walkability analysis (0–200m, 200–500m, 500–1km)
- Feeder route access (jeepneys, UV Express, tricycles, bus stops)
- Visibility from station exits and arterial roads
- Traffic flow and ingress/egress feasibility
4. Zoning, Permits & Compliance
- Current zoning classification and permitted uses
- FAR limits, height restrictions, and TOD overlays
- Required special permits (TIA, ECC, barangay clearance)
- Alignment risks with DOTr, DPWH, LGU road-widening plans
5. Utilities & Infrastructure Readiness
- Water pressure and connection availability
- Electrical load expansion feasibility
- Sewer line availability and capacity
- Fiber and telecom viability for commercial tenants
6. Development Feasibility Indicators
- Frontage width and optimal site layout
- Potential for modular activation or pop-up uses
- Suitability for mixed-use, logistics, retail, or parking
- Estimated yield based on real-world comparables
7. Tax & Financial Considerations
- RPT liabilities under commercial classification
- CGT implications for sellers
- DST and transfer tax cost modeling for buyers
- Holding cost projection for 12–36 months

Subscribe to our page to download your free Checklist.
FAQs
Commercial lots within a 200–300 meter radius of MRT or LRT stations typically command a 20–40% price premium over comparable lots outside transit corridors.
In ultra-prime stations—Ayala, Ortigas, Cubao, North Avenue—the premium can push beyond 50–70%, especially for corner lots or parcels suited for mixed-use development..
This premium reflects:
- Guaranteed foot traffic
- Higher rent ceilings for retail and logistics
- Stronger long-term absorption
- Greater development flexibility due to favorable zoning
- Lower vacancy risk
Generally yes, but only if the micro-location fundamentals check out. Transit proximity creates strong demand—but profitability depends on four critical filters:
- Walkability: If access is unsafe, convoluted, or flood-prone, foot traffic drops sharply.
- Zoning compatibility: Some areas near stations still restrict height, FAR, or certain commercial uses.
- Environmental and ROW risks: Lots affected by future road widening or drainage alignments may lose buildable area.
- Market saturation: Too many similar businesses (e.g., convenience stores, small F&B) can compress margins.
Transport-hub lots provide amplified return potential, but they aren’t “plug-and-play” investments. Due diligence decides whether the site becomes a high-yield engine or an overpriced, underperforming parcel.
For investors seeking maximum upside, buying during early- to mid-construction delivers the strongest blend of affordability and certainty.
Why buying early works:
- Values typically start rising once right-of-way is secured.
- Private developers begin scouting land once construction is visible.
- Speculation quiets down, but prices haven’t reached “operational phase” levels.
- Early entrants capture pre-opening appreciation, which can reach 30–50% depending on the corridor.
Why waiting can be costly:
- Once a station opens, land prices “jump to market reality.”
- Zonal values rise, increasing both purchase price and taxes.
- Demand from national retailers and logistics firms intensifies—reducing negotiation leverage.
But:
If the project faces delays or uncertainty, waiting until major construction milestones may be prudent. Investors with moderate risk appetite should target the window when civil works are 40–60% complete and timelines become more predictable.
Conclusion — The Window of Opportunity
Transport infrastructure is reshaping the Philippines with a force that rarely converges in one development cycle. Every MRT extension, every LRT link, every NSCR station under construction pulls economic gravity toward its orbit—quietly rewriting the map of where growth will concentrate over the next decade.
Commercial lots near these mobility engines aren’t just appreciating. They’re becoming the new power parcels—the sites national developers compete for, the sites retailers open their most profitable branches on, the sites logistics firms rely on for speed and efficiency. When a corridor gains a station, it doesn’t simply get busier. It becomes a magnet for capital, and land values adjust upward with remarkable consistency.
What makes today unique is timing. For the first time in decades, multiple megaprojects—NSCR, MRT-7, LRT-1 Cavite Extension, Mega Manila Subway, provincial terminal upgrades—are advancing simultaneously. This kind of infrastructure clustering creates exponential uplift, not linear growth.
But this window doesn’t stay open forever.
Once stations become operational, prices harden. Zonal values rise. Developers lock in parcels. And the early, steep appreciation curve flattens into maturity. Investors who waited for “certainty” often end up paying for everyone else’s confidence.
If you’re studying these corridors now, you’re doing it at the right moment. The opportunity is still asymmetric: limited supply, rising demand, and the powerful multiplier effect of mobility-driven commerce.
Identify the right micro-location. Validate the zoning. Run the financials. Then take position before the market finishes waking up.
Because in real estate, value flows to the places where people move—and the Philippines is about to move unlike ever before.
You’re looking at one of the strongest real estate plays in the Philippines today. The only question is whether you’ll move while the window is still open. If you’re evaluating a commercial lot near a major transport corridor—or considering buying into one—now is the moment to get expert support.
Get Strategic, Data-Driven Guidance — Book a Consultation
If you want clarity on whether your target lot is undervalued, overvalued, or positioned for explosive appreciation, schedule a one-on-one advisory session.
We’ll evaluate:
- Micro-location strength
- Zoning and TOD potential
- Nearby development pipelines
- Rental and yield forecasts
- Exit or JV scenarios
A single insight can shift your investment trajectory.
Request a Professional Land Valuation
Not all transport-corridor lots are equal. A data-backed valuation gives you the confidence to negotiate smarter—whether you’re buying, holding, or preparing to sell.
You’ll receive:
- Comparable sales
- Zoning verification
- Projected appreciation tied to corridor timelines
- Highest-and-best-use analysis
Turn uncertainty into strategy.
Stay First in Line for High-Impact Opportunities
If you want early alerts on new MRT/LRT station announcements, right-of-way progress, market shifts, and upcoming corridors before they hit mainstream news, join the Transport Corridor Investment Newsletter.
Subscribers get first access to:
- Market intelligence
- Off-market listing opportunities
- Investment-grade analysis
- New due diligence tools and checklists
Make decisions before the rest of the market reacts.
Your next high-performing investment isn’t far away. It’s already on the map—right along the country’s most powerful transport corridors.
Let’s identify it together.


Leave a comment