
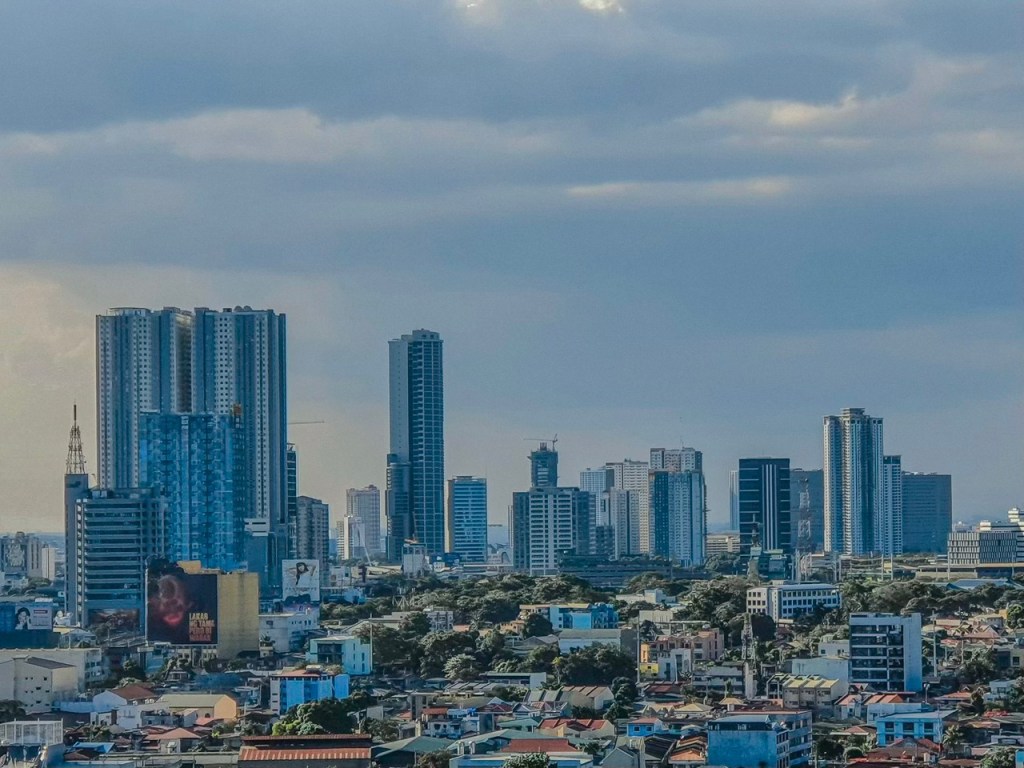
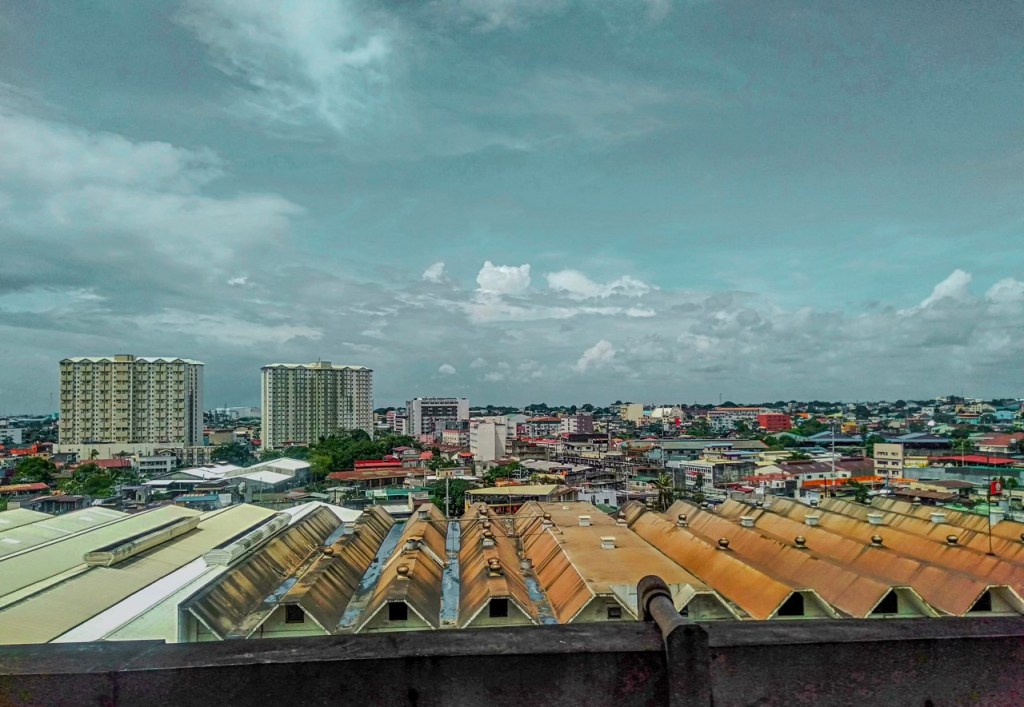
Metro Manila is not a single market. Treating it as one is how buyers overpay, investors misjudge returns, and renters end up frustrated. This region is a dense, fast-moving mosaic of cities, districts, and micro-markets—each with its own pricing logic, lifestyle trade-offs, and investment behavior.
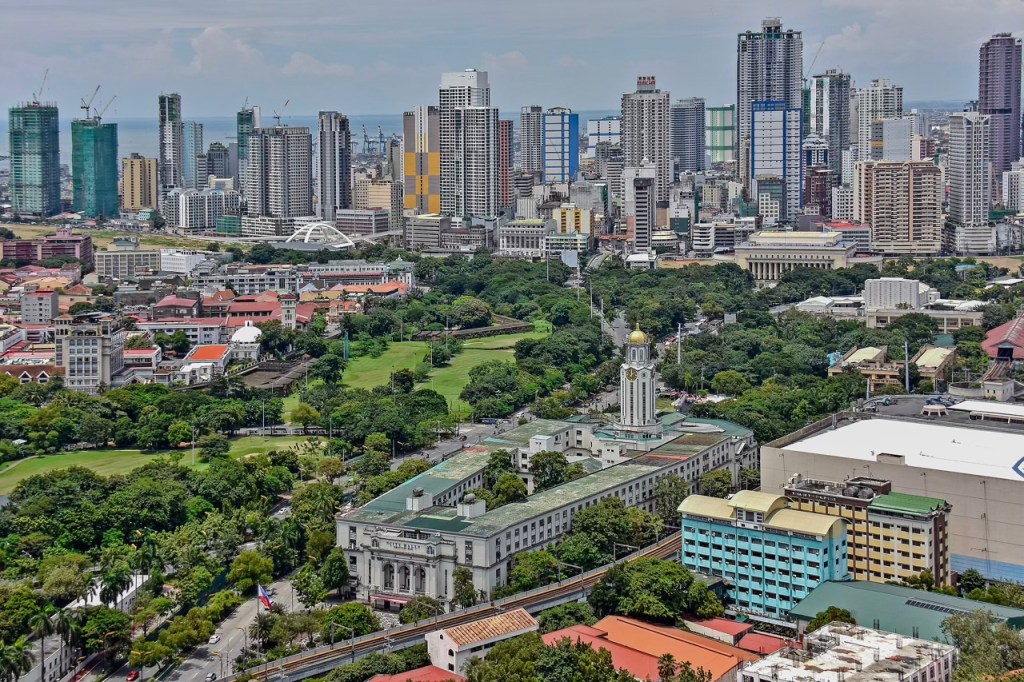
As the country’s economic and political center, Metro Manila remains the most active and liquid real estate market in the Philippines, concentrating the highest-paying jobs, deepest rental demand, and strongest resale activity. The National Capital Region consistently accounts for a disproportionate share of the Philippines’ GDP, formal employment, and high-value property transactions, making Metro Manila the country’s most liquid and data-rich real estate market.
It hosts the nation’s primary CBDs, leading universities and hospitals, and the bulk of large-scale infrastructure investment. That gravity has kept demand resilient through cycles, even as congestion narratives dominate casual conversations.
For buyers, the decision is rarely about “whether” Metro Manila makes sense—it is about where and why. A studio in BGC behaves nothing like a townhouse in Parañaque. A pre-selling unit along a future rail corridor plays a different game from a resale condo in an established CBD. The returns, risks, and daily experience diverge sharply within a few kilometers.
This Metro Manila real estate guide cuts through the noise. It breaks Metro Manila property market down city by city and strategy by strategy, grounding every section in market reality: pricing bands, rental dynamics, infrastructure impact, and livability factors that actually influence value.
Whether you are a first-time buyer, an OFW building a home base, or an investor deploying capital with discipline, the goal is simple—clarity before commitment.
13+ Million Residents
16 Cities
~36% of PH GDP
Why Metro Manila Still Defines Philippine Real Estate
Power concentrates where decisions, capital, and talent converge. In the Philippines, that gravity sits squarely in Metro Manila. The National Capital Region anchors the country’s executive branch, financial system, corporate headquarters, and professional services ecosystem. It commands a disproportionate share of national GDP, formal employment, and high-value transactions.
What sustains housing demand?
When businesses expand, relocate, or regionalize, they land here first. Real estate demand follows that certainty. Historically, a majority of Grade A office stock, multinational headquarters, and top-tier professional services firms remain concentrated within Metro Manila, reinforcing sustained housing and rental demand.
Despite recurring concerns about congestion, the Metro Manila property market continues to attract end-users and investors because demand is anchored in jobs, infrastructure, and long-term economic relevance. Buyers and tenants pay more to live closer to work, schools, hospitals, and transit nodes because time is the scarcest resource in the capital. This is why CBD-adjacent districts, mixed-use estates, and rail-connected corridors continue to absorb inventory faster than peripheral markets. The narrative says “avoid Metro Manila.” The data says “choose precisely.”
That distinction matters more here than anywhere else in the country.
Who keeps buying?
End-users with stable incomes who value proximity and services. OFWs securing a Philippine asset with liquidity and rental depth. Investors prioritizing predictable tenant demand over speculative upside. Corporations leasing and acquiring space to attract talent and shorten commute friction. These segments do chase reliability and Metro Manila delivers it through scale, diversity, and market depth—qualities no other region in the country can replicate.
The result is a market that resets quickly after shocks and rewards informed decisions. Metro Manila defines Philippine real estate not because it is perfect, but because it is indispensable.
Why Demand Concentrates in Metro Manila
GDP Contribution
█████████████████ Metro Manila (~36%)
██████████ Rest of PH
Formal Employment
███████████████ Metro Manila (~30%)
████████████ Rest of PH
Real Estate Activity
██████████████████ Metro Manila (largest share)
████████ Other regions
Metro Manila concentrates a disproportionate share of the Philippines’ economic output, employment, and real estate activity. This density of jobs and capital is why rental demand, liquidity, and long-term relevance remain structurally stronger here than in any other region.
Understanding Metro Manila as a Multi-Market, Not One City
Administratively, the National Capital Region is composed of 16 highly urbanized cities and one municipality, each with its own zoning rules, local taxes, infrastructure priorities, and development patterns. Treating Metro Manila as a single real estate market is a category error. In practice, it functions as a tightly connected region of distinct micro-markets, linked by commerce and transport but driven by very different demand engines.
Pricing makes this clear immediately
Value differences across districts are structural. A studio condominium in a prime CBD can cost several times more than a similar-sized unit just a few kilometers away—even within the same city—because of zoning intensity, rail access, office density, and tenant depth. Price reflects how land is allowed to be used and who needs to be there every day.
Lifestyle outcomes diverge just as sharply
Some districts are optimized for walkability, vertical living, and proximity to offices, where convenience outweighs space. Others are designed around family life—schools, hospitals, quieter streets, and lower density. A neighborhood that excels for a young professional may be misaligned for a family, and vice versa. These are not subjective preferences, they are built into the urban fabric of each district.
Return profiles follow function
Rental-heavy CBDs tend to deliver lower but more stable yields, faster lease-up, and stronger exit liquidity. Emerging corridors and redevelopment zones, by contrast, trade immediate income for capital appreciation tied to infrastructure delivery and area maturation. These differences are not cyclical quirks. They are the result of how demand is generated and sustained in each location. Ignoring this distinction compounds mistakes quickly.
The most common—and costly—error buyers and investors make is treating “Metro Manila” as a monolith. They compare prices across cities without adjusting for tenant demand. They evaluate ROI without factoring in commute friction, supply pipelines, or developer concentration. They assume that a strategy that works in one district will translate cleanly to another. It rarely does.
The correct lens is micro-markets: CBD cores, transit-oriented corridors, mature residential zones, and redevelopment pockets. Each requires a different strategy, a different holding period, and a different risk tolerance. Mastery here is about understanding which pocket aligns with your objective and not about knowing every city.
If Metro Manila feels complex, that is because it is. Clarifying which micro-market fits your goal—income stability, capital growth, or long-term livability—early in the process prevents expensive trial-and-error later. There is no shortcut to this understanding. Once clear, decision-making becomes dramatically easier—and far more defensible.
Metro Manila: Key Business Districts and Residential Clusters
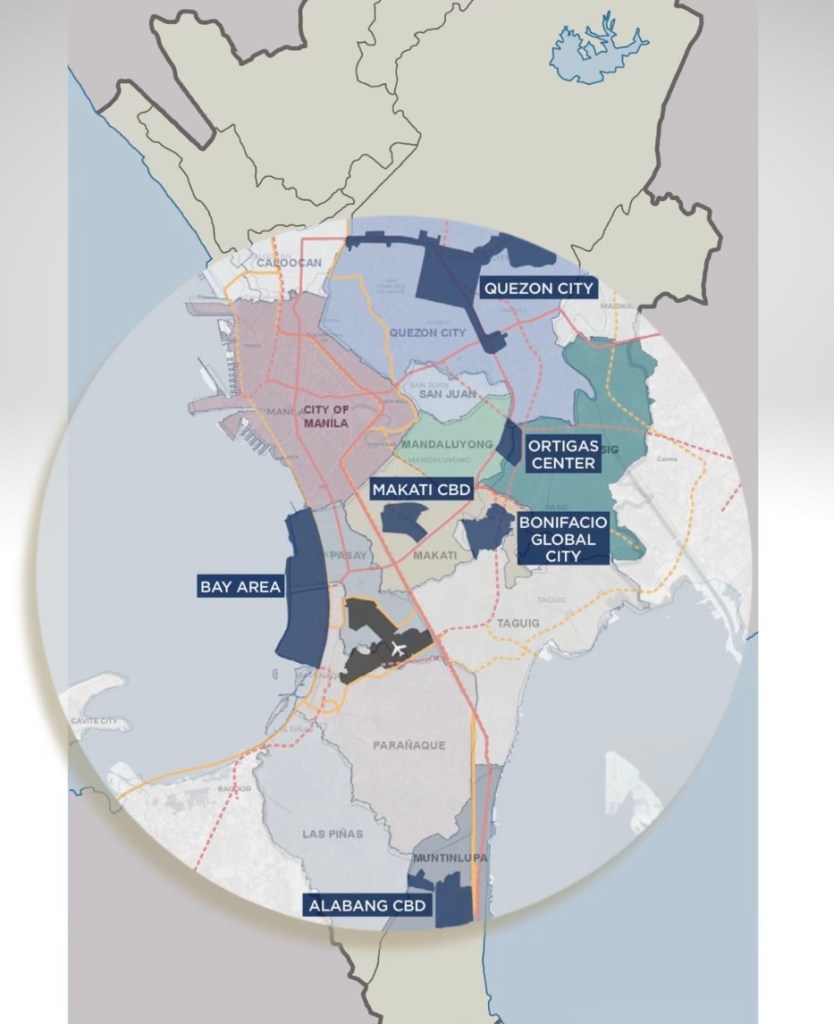
This map illustrates why Metro Manila functions as a collection of distinct micro-markets rather than a single city. Property pricing, rental demand, and lifestyle outcomes vary significantly depending on proximity to these clusters.
Major Cities and Districts — Where Each One Excels
Real estate performance in Metro Manila is dictated by function and not by labels. Each city—and often each district within a city—plays a specific role shaped by employment density, transport access, zoning intensity, and lifestyle infrastructure. Understanding which locations are optimized for income, growth, or livability is the difference between a strategic purchase and an expensive compromise when deciding where to buy property in Metro Manila.
Core Business and Financial Districts (CBDs)
Across Metro Manila, CBD pricing tracks employment density and leasing velocity. Districts with concentrated offices, transit access, and year-round tenant demand command premium values because they convert proximity into time savings and rental certainty.
Makati CBD
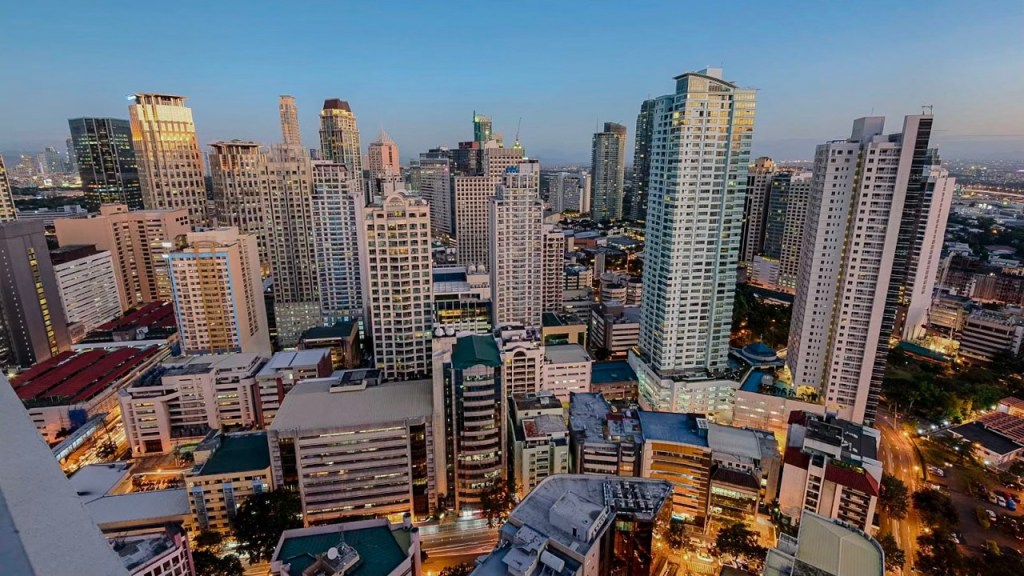
Market Positioning
The country’s traditional financial and corporate nerve center, anchored by multinational headquarters, banks, and professional services firms.
Typical Buyers and Renters
Executives, dual-income professionals, expatriates, and long-term investors prioritizing liquidity.
Property price bands
The country’s traditional financial and corporate nerve center, anchored by multinational headquarters, banks, and professional services firms.
Lifestyle trade-offs
Executives, dual-income professionals, expatriates, and long-term investors prioritizing liquidity.
Bonifacio Global City
Market Positioning
A master-planned CBD built around modern work-live-play integration, strong corporate leasing, and lifestyle branding.
Typical Buyers and Renters
Young professionals, expatriates, corporate tenants, and yield-focused investors.
Property price bands
Premium to ultra-premium, supported by strong rental demand and consistent absorption.
Lifestyle trade-offs
Highly walkable and modern, but smaller unit sizes and stricter estate controls.
Ortigas Center
Market Positioning
A central, mixed-use business district bridging multiple cities with competitive pricing relative to Makati and BGC.
Typical Buyers and Renters
Mid- to senior-level professionals, families, and value-driven investors.
Property price bands
Premium to ultra-premium, supported by strong rental demand and consistent absorption.
Lifestyle trade-offs
Highly walkable and modern, but smaller unit sizes and stricter estate controls.
Residential and Lifestyle-Oriented Cities
These areas prioritize long-term residence and community infrastructure over pure office density. Demand here is driven by families, end-users, students, and long-hold owners rather than transient corporate tenants.
Quezon City
Market Positioning
The most diversified residential city, balancing government institutions, universities, hospitals, and emerging CBDs.
Typical Buyers and Renters
Families, professionals, students, long-term investors.
Property price bands
Broad—from entry-level condos to premium subdivisions.
Lifestyle trade-offs
Strong education and healthcare; traffic varies sharply by district.
Parañaque City
Market Positioning
Mature southern residential city anchored by subdivisions, airport access, and lifestyle retail.
Typical Buyers and Renters
Families, OFWs, aviation-linked professionals.
Property price bands
Mid to upper-mid; premium gated villages.
Lifestyle trade-offs
Excellent airport proximity; peak-hour congestion.
Las Piñas City

Market Positioning
Suburban-oriented, space-forward living.
Typical Buyers and Renters
Families, first-time buyers, long-term residents.
Property price bands
Generally more affordable than central NCR.
Lifestyle trade-offs
Quieter living; longer CBD commutes.
San Juan City

Market Positioning
Compact, centrally located with upscale neighborhoods.
Typical Buyers and Renters
Affluent families, professionals, downsizers.
Property price bands
Upper-mid to premium due to limited land supply.
Lifestyle trade-offs
Excellent centrality; limited new inventory.
Pasig City (outside Ortigas)

Market Positioning
Mixed residential city with CBD-adjacent and community-focused districts.
Typical Buyers and Renters
Professionals, families, hybrid investor–end users.
Property price bands
Mid to premium by proximity to Ortigas.
Lifestyle trade-offs
Strong access; traffic and flooding vary by area.
Mandaluyong City (outside Ortigas)

Market Positioning
Highly central residential bridge between major CBDs.
Typical Buyers and Renters
Professionals working in Makati, Ortigas, or BGC.
Property price bands
Mid to upper-mid, driven by location.
Lifestyle trade-offs
Exceptional access; density pressure and limited space.
Caloocan City
Market Positioning
Divided city serving working-class and emerging middle-income markets.
Typical Buyers and Renters
Local families, value buyers, small investors.
Property price bands
Lower to mid-range.
Lifestyle trade-offs
Affordability; uneven infrastructure.
Malabon City
Market Positioning
Traditional residential city with strong community roots.
Typical Buyers and Renters
Local families, long-term residents.
Property price bands
Generally affordable.
Lifestyle trade-offs
Community feel; flood mitigation and access matter.
Navotas City
Market Positioning
Dense residential-industrial city.
Typical Buyers and Renters
Workforce housing tenants, local residents.
Property price bands
Lower-end.
Lifestyle trade-offs
Affordability; limited lifestyle amenities.
Valenzuela City
Market Positioning
Northern residential-industrial hybrid with improving access.
Typical Buyers and Renters
Families, industrial workforce, value investors.
Property price bands
Lower to mid-range.
Lifestyle trade-offs
Improving connectivity; car dependence persists.
Marikina City
Market Positioning
Well-planned residential city known for governance and livability.
Typical Buyers and Renters
Families, owner-occupiers.
Property price bands
Mid-range with strong end-user demand.
Lifestyle trade-offs
Fewer high-rise options.
Muntinlupa City
Market Positioning
Southern premium residential city anchored by gated villages and business parks.
Typical Buyers and Renters
Affluent families, executives.
Property price bands
Upper-mid to premium.
Lifestyle trade-offs
High livability; farther from northern CBDs.
City of Manila
Market Positioning
Historic core with universities, hospitals, and redevelopment pockets.
Typical Buyers and Renters
Students, professionals, redevelopment investors.
Property price bands
Very wide—from low entry points to premium zones.
Lifestyle trade-offs
Institutional access; density and aging infrastructure in parts.
Pateros
Market Positioning
The lone municipality with small-scale residential character.
Typical Buyers and Renters
Local residents, value renters.
Property price bands
Generally affordable.
Lifestyle trade-offs
Central proximity; limited inventory and amenities.
Makati City (outside the CBD)

Market Positioning
Established villages and low-rise neighborhoods serving long-term residents without CBD density.
Typical Buyers and Renters
Affluent families, professionals, legacy homeowners.
Property price bands
Upper-mid to premium due to land scarcity and proximity.
Lifestyle trade-offs
Security and stability; limited new supply.
Taguig City (outside BGC)

Market Positioning
Transitional residential city shaped by spillover demand from BGC.
Typical Buyers and Renters
Professionals priced out of BGC, families, military-affiliated households.
Property price bands
Wide—from affordable pockets to mid-range near BGC edges.
Lifestyle trade-offs
Proximity upside; uneven planning by barangay.
Pasay City (outside the Bay Area)

Market Positioning
Dense, centrally located residential city anchored by legacy neighborhoods and transport.
Typical Buyers and Renters
Local families, students, airport-linked workers.
Property price bands
Lower to mid-range versus Bay Area projects.
Lifestyle trade-offs
Exceptional centrality; older infrastructure and higher density.
Emerging and Redevelopment Areas
These districts attract buyers willing to trade immediacy for future upside, with performance tied to project delivery and area maturation.
Pasay Bay Area
Market Positioning
Mixed-use entertainment and tourism corridor.
Typical Buyers and Renters
Investors, short-term rental operators, overseas buyers.
Property price bands
Mid to premium; wide variance by project maturity.
Lifestyle trade-offs
Upside and velocity; construction cycles and seasonality.
Vertis North

Market Positioning
Master-planned CBD redefining northern Metro Manila.
Typical Buyers and Renters
Early adopters, North QC professionals, long-term investors.
Property price bands
Mid to upper-mid with phased appreciation.
Lifestyle trade-offs
Organized and future-forward; still building out.
There is no single “best” city in Metro Manila—only the best fit for your objective: income stability, capital growth, daily convenience, or long-term livability. Buyers who win are not those who buy everywhere early, but those who choose deliberately in the right district for the right reason. If you are torn between locations, shortlist by goal first; prices alone are a poor filter.
At-a-Glance: How Metro Manila Cities and Districts Compare
| City / District | Typical Price Range | Buyer / Renter Profile | Rental Demand |
|---|---|---|---|
| Makati Central Business District | Premium to Ultra-Premium | Executives, expatriates, senior professionals, long-term investors | Very High |
| Bonifacio Global City | Premium | Young professionals, corporate tenants, expatriates, yield-focused investors | Very High |
| Ortigas Center | Upper-Mid to Premium | Professionals, families, value-driven investors | High |
| Quezon City | Low to Premium | Families, professionals, students, long-term investors | High |
| Makati City (Residential areas) | Upper-Mid to Premium | Affluent families, professionals, long-term owner-occupiers | High |
| San Juan City | Upper-Mid to Premium | Affluent families, professionals, downsizers | High |
| Pasig City (Outside Ortigas) | Mid to Premium | Professionals, families, hybrid end-user investors | High |
| Mandaluyong City (Outside Ortigas) | Mid to Upper-Mid | Professionals working across CBDs, renters | High |
| Taguig City (Outside BGC) | Low to Mid | Families, professionals priced out of BGC, value end-users | Moderate |
| Pasay City (Outside Bay Area) | Low to Mid | Local families, transport-linked workers, students | Moderate |
| Parañaque City | Mid to Upper-Mid | Families, OFWs, aviation-linked professionals | Moderate |
| Las Piñas City | Low to Mid | Families, first-time buyers, long-term residents | Moderate |
| Muntinlupa City | Upper-Mid to Premium | Affluent families, executives, long-term residents | Moderate |
| Marikina City | Mid | Families, owner-occupiers prioritizing livability | Moderate |
| Valenzuela City | Low to Mid | Families, industrial workforce, value investors | Moderate |
| Manila City | Low to Premium | Students, professionals, redevelopment investors | High (selective by area) |
| Caloocan City | Low to Mid | Local families, value-driven buyers | Moderate |
| Malabon City | Low | Local families, long-term residents | Limited to Moderate |
| Navotas City | Low | Workforce housing, local residents | Limited |
| Pateros | Low | Local residents, value renters | Limited |
| Pasay Bay Area | Mid to Premium | Investors, short-term renters, overseas buyers | High (cyclical) |
| Vertis North | Mid to Upper-Mid | Early adopters, professionals, growth investors | High (cyclical) |
Rental demand and pricing vary sharply by location. This table summarizes where each city sits in Metro Manila’s real estate hierarchy.
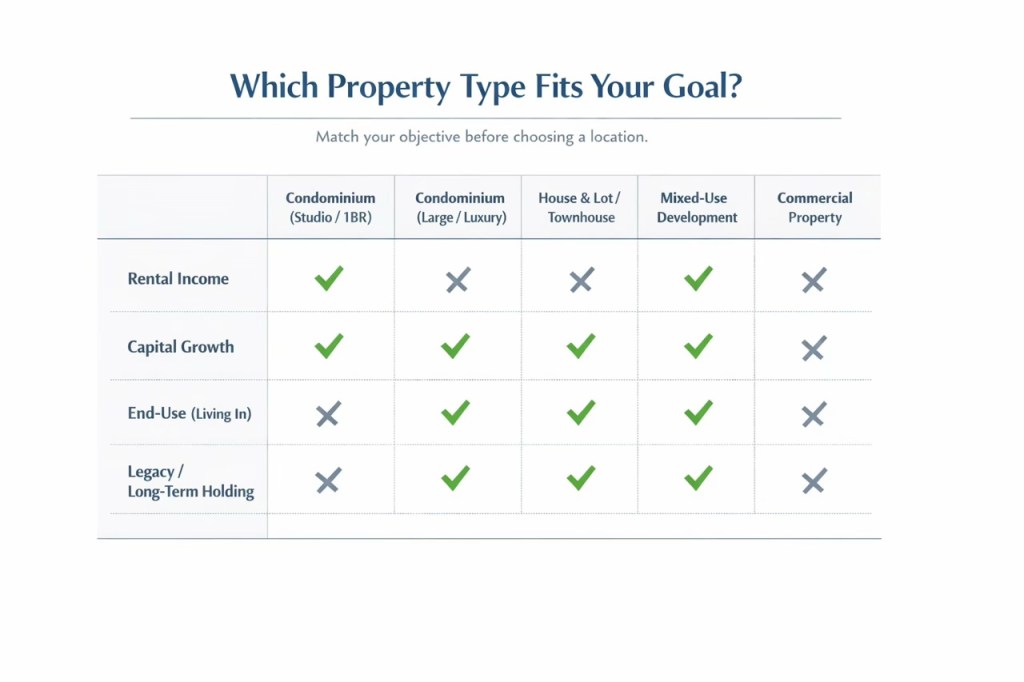
Metro Manila Property Types Explained
Property performance in Metro Manila is driven less by which city you choose and more by which property type you buy—and why. Transaction data and on-the-ground leasing behavior consistently show that misalignment between asset type and intended use is a leading cause of underperforming properties. From entry-level studio condos to luxury residences and landed homes, outcomes vary sharply based on unit size, building profile, tenant demand, and exit liquidity—not location alone.
In practical terms, buyers who miss their targets usually chose the wrong asset for their objective, not the wrong neighborhood. Each property type plays a distinct role in the NCR ecosystem, with different capital requirements, risk profiles, income behavior, and resale dynamics. Understanding these differences is non-negotiable.
Condominium Units (Studio to Luxury)
Condominiums dominate Metro Manila’s urban core because they match how demand is generated: dense employment centers, limited land, and constant tenant churn.
Studios and one-bedroom units
These engineered for liquidity and rental efficiency. They are the default choice for investors, young professionals, and OFWs seeking lower entry points, faster lease-up, and easier resale. In CBDs and mixed-use estates, these units benefit from deep, year-round tenant pools.
Two- and three-bedroom units
These along with luxury residences, serve a different market. These target executives, expatriates, and long-term end-users who prioritize proximity and convenience over floor area. The trade-offs are higher prices, association dues, and density. The upside is consistent demand in prime locations and strong resale depth when the building and developer are well regarded.
Best suited for: Rental income strategies, liquidity-focused investors, urban end-users
Key risks: Oversupply in weak locations, mispriced large units, poor building management
House and Lot (Townhouses and Single-Detached Homes)
Landed properties operate on a different axis. Townhouses and single-detached homes appeal to families and owner-occupiers seeking privacy, space, and community stability. These assets are concentrated in residential cities and gated subdivisions rather than CBD cores, where land scarcity pushes values upward over time.
Pricing varies widely based on land value, subdivision quality, flood mitigation, and local governance. While rental yields are typically lower than condominiums, land appreciation and long-term livability anchor value. Liquidity is slower, transactions are more bespoke, and holding periods tend to be longer—but ownership satisfaction is often higher.
Best suited for: End-users, long-term family living, legacy holdings
Key risks: Slower resale, higher maintenance, location-specific flood or access issues
Mixed-Use Developments
Mixed-use developments blur the line between living, working, and leisure. These estates integrate residential towers with offices, retail, hotels, and transport access. Their advantage is self-contained demand—residents become tenants of the ecosystem, and foot traffic supports retail and services.
Buyers pay a premium for convenience and resilience. Performance depends heavily on master planning, phasing, and developer execution. Well-run estates deliver strong occupancy and price stability; poorly executed ones struggle despite good locations.
Best suited for: Convenience-driven end-users, resilient rental strategies
Key risks: Premium pricing, reliance on developer and estate management quality
Commercial and Office Assets
Commercial properties—including office units, retail spaces, and entire buildings—serve institutional and high-net-worth strategies. Entry costs are higher, tenant acquisition is more specialized, and regulatory requirements are stricter. When aligned correctly, these assets offer longer lease terms and income stability. When misaligned, vacancy risk escalates quickly.
This segment rewards experience, active management, and strong tenant relationships. It is not forgiving to passive or first-time buyers without professional support.
Best suited for: Experienced investors, HNWIs, operating businesses
Key risks: Tenant concentration, economic sensitivity, management intensity
New Developments vs. Resale Properties
The decision framework here is not new versus old. It is risk versus reward.
Pre-selling (New Developments):
Pre-selling units attract buyers targeting appreciation and flexible payment terms. Entry prices are lower, capital is deployed gradually, and upside is tied to project delivery and area growth. Risks include construction delays, market shifts, and opportunity cost during the build period.
Ready-for-Occupancy (RFO):
RFO units prioritize immediacy. Buyers can move in or lease out quickly, making them ideal for end-users and income-focused investors. Pricing reflects completion certainty, but cash flow begins sooner.
Resale / Secondary Market:
Resale properties offer transparency. Location maturity, building condition, and actual rental performance are observable. Negotiation opportunities exist, but inventory quality varies widely. Due diligence is mandatory, not optional.
Growth-oriented buyers accept uncertainty for upside. Stability-oriented buyers pay for clarity. Metro Manila offers both—provided the property type matches the goal.
Most underperforming purchases fail at this stage. Aligning property type with intent before viewing listings saves time, capital, and regret—and is the single highest-leverage decision a buyer can make.
Investment Performance and ROI in Metro Manila
Real estate returns in Metro Manila are not accidental. They are the result of demand density, land scarcity in prime districts, and sustained rental absorption anchored by employment hubs. Across multiple market cycles, properties in established CBDs have shown steady, defensible capital appreciation, while transit-adjacent and redevelopment zones have delivered sharper—but less predictable—uplifts tied to infrastructure completion and area maturation.
This distinction matters. In high-demand districts, renting can outperform buying in the short term, particularly for mobile professionals. Over longer holding periods, however, ownership in Metro Manila consistently favors buyers with location certainty and demand-aligned assets. ROI here is less about timing the market and more about choosing where demand persists regardless of cycle noise.
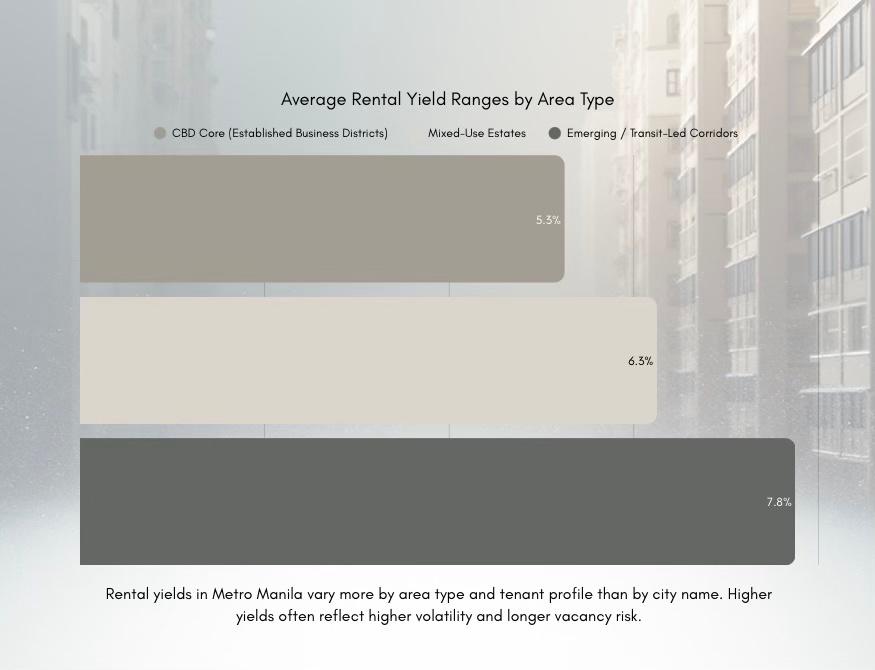
Rental Yields in Core CBDs
Rental yields in Metro Manila vary by district function, not by city name. In established CBDs, yields typically compress into mid-single-digit ranges, reflecting higher entry prices. The trade-off is reliability: shorter vacancy periods, faster lease-up, and stronger exit liquidity.
Core CBDs deliver moderate but dependable income, supported by year-round demand from professionals, expatriates, and corporate tenants. These locations rarely produce headline yields, but they excel at capital preservation and resale depth—key considerations for disciplined investors.
Yields in Fringe and Emerging Areas
Fringe and emerging districts can post higher initial yields, particularly at early entry points. However, these returns are more sensitive to supply influx, project delivery, and tenant depth. Vacancy cycles tend to be longer, and performance varies sharply between projects.
Suburban residential zones generally skew lower on rental yields but compensate through land appreciation and end-user stability. This is why Metro Manila rewards investors who decide what outcome they want—income or growth—before deciding where to buy. Yield alone is an incomplete signal.
Investor Strategies That Actually Work
Most investors in Metro Manila fall into one of two strategic camps:
Cash-flow strategies prioritize consistent rental income, fast lease-up, and liquidity. These typically focus on studio and one-bedroom units in CBDs and well-executed mixed-use estates, where tenant demand is deepest.
Appreciation strategies accept delayed income or lower yields in exchange for capital growth. These target pre-selling projects, infrastructure-led corridors, and early-phase master-planned districts, where value is unlocked over time.
The most common mistake is blending these strategies without acknowledging the trade-offs. Metro Manila does not reward ambiguity. It rewards clarity of intent.
Proven approaches in the NCR include long-hold leasing in prime locations, buy-and-hold accumulation of small units, selective flipping in maturing districts, and portfolio balancing between CBD cores and growth corridors. The consistent winners are disciplined, data-driven, and patient. Speculation without demand alignment rarely survives a full cycle.
What Actually Drives ROI in Metro Manila
If return expectations feel unclear, a simple comparison—cash flow versus appreciation—often reveals which districts and property types deserve attention. The following factors determine whether projected returns materialize.
Infrastructure
Rail lines, expressways, and transport interchanges reshape value by compressing travel time and expanding tenant catchment areas. Price movement typically follows three phases: announcement, construction, and completion. Early entrants accept uncertainty; later entrants pay for certainty. Sustainable ROI emerges when infrastructure solves a real mobility constraint, not when it merely looks good on a map.
Tenant Demand
Properties near offices, schools, hospitals, and transit hubs lease faster and retain value longer. Yield stability consistently outperforms optimistic projections. In Metro Manila, demand proximity matters more than unit features.
Developer Quality
Developer execution influences everything from building longevity to resale ease. Projects delivered by established developers show stronger resale liquidity, better tenant retention, and more predictable maintenance outcomes. Delays, poor management, and brand erosion quietly destroy ROI through vacancies and buyer resistance.
Exit Liquidity
A profitable asset on paper means little if resale demand is thin. Prime districts in Metro Manila excel in liquidity because buyers and tenants are always present. Fringe locations must earn liquidity over time through absorption and maturity. Exit planning is not optional—it is part of the investment decision from day one.
In Metro Manila, ROI is not driven by hype or isolated metrics. It is driven by demand fundamentals, execution quality, and strategic alignment. Investors who respect these realities do not just earn returns—they control risk.
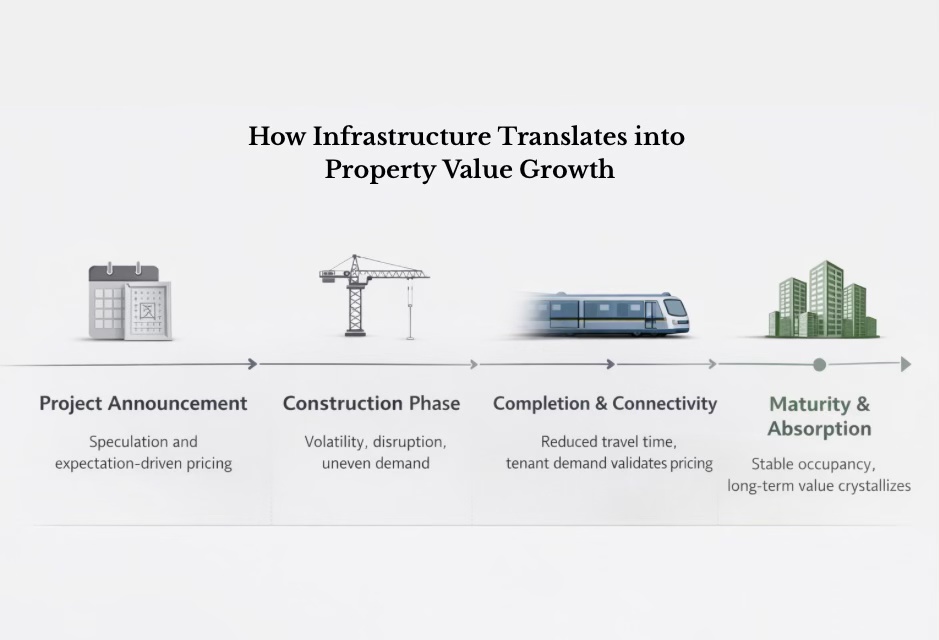
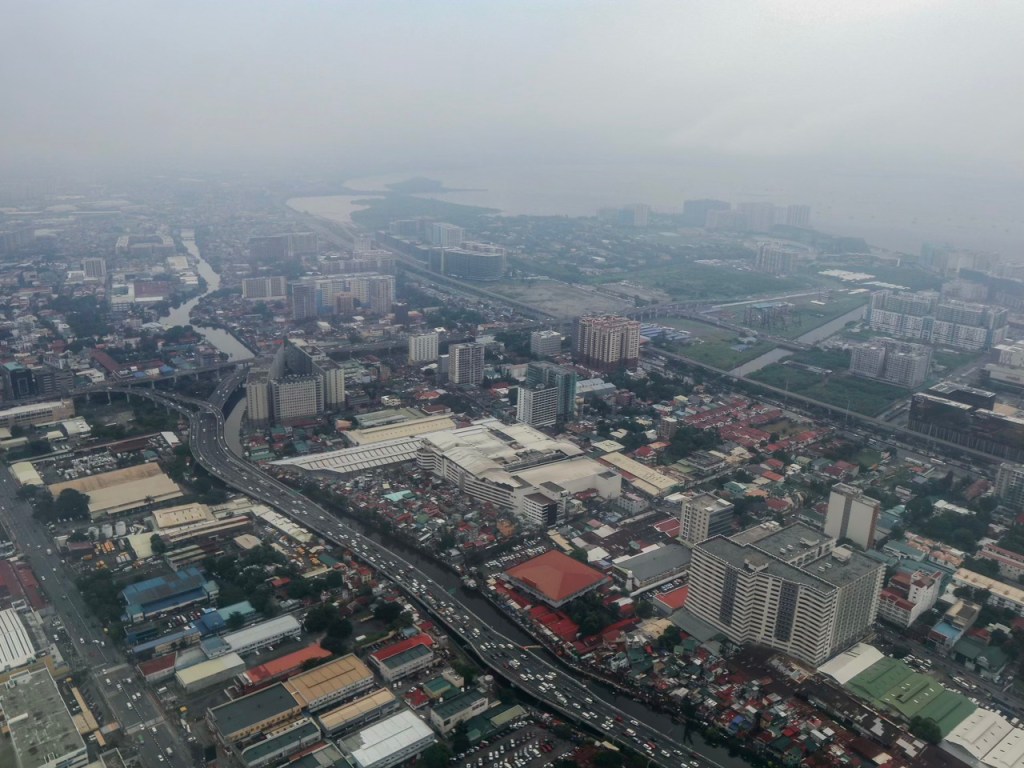
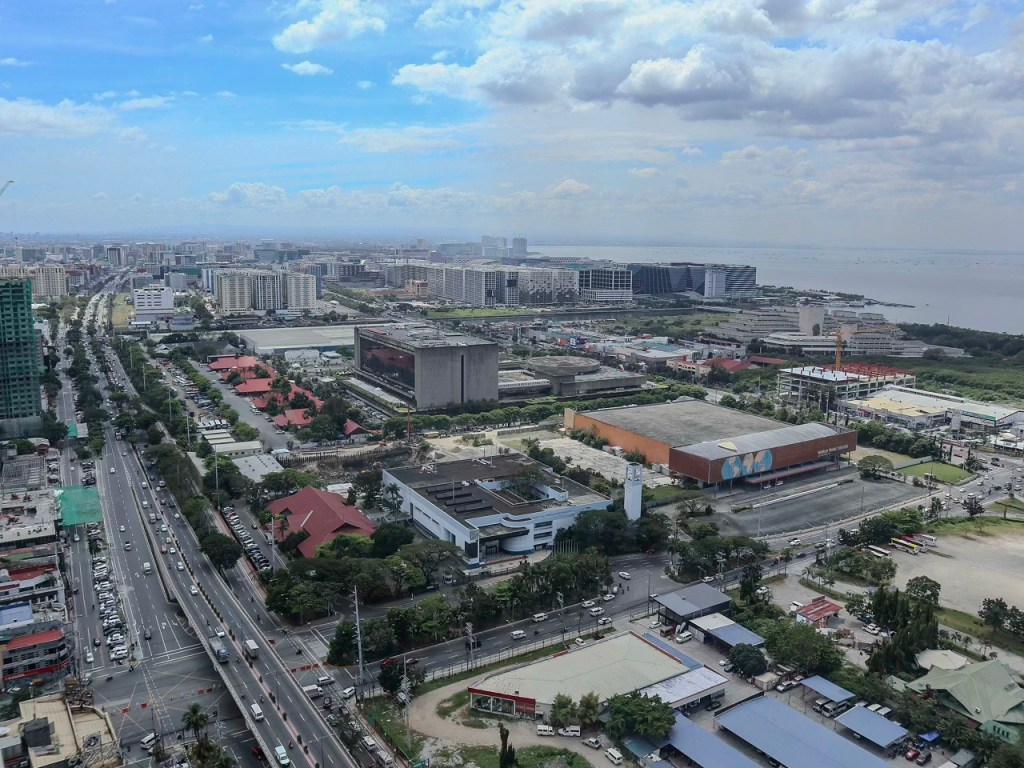
Infrastructure and Urban Growth Catalysts
Infrastructure is the structural force that reshapes real estate value in Metro Manila. Across multiple market cycles, transport- and access-led development has proven to be one of the most reliable drivers of sustained property value growth, particularly when infrastructure directly reduces travel time, expands employment reach, and integrates land use. While public discourse often fixates on congestion, capital consistently follows projects that solve mobility constraints. The result is a continual reallocation of demand—from legacy cores to transit-oriented, logistics-connected, and redevelopment districts.
Rail Networks and Mass Transit
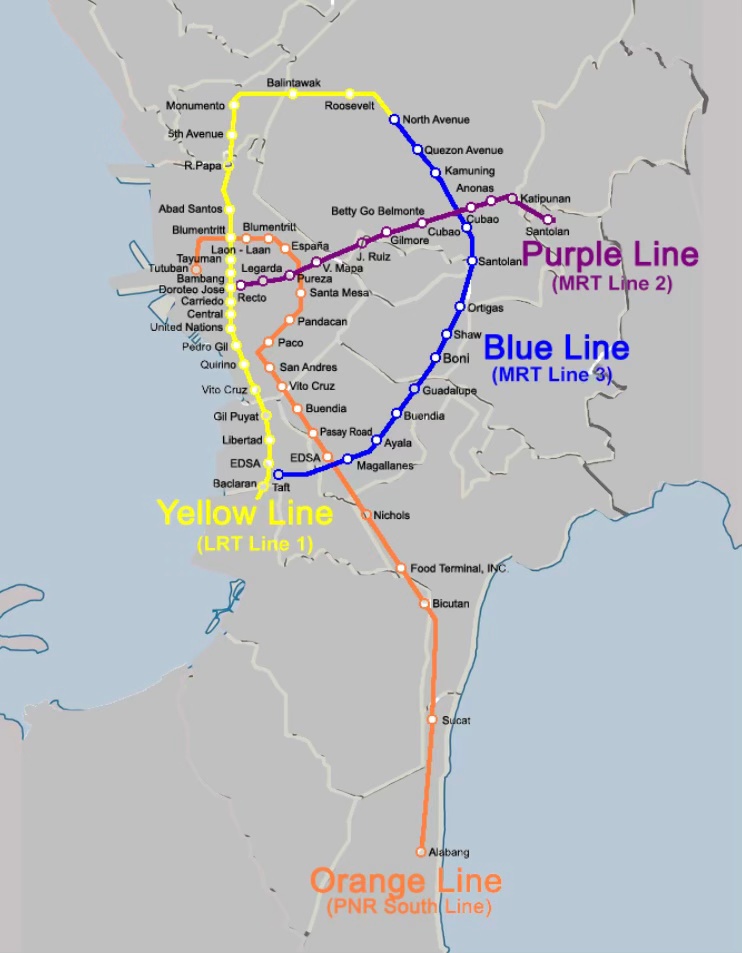
Rail infrastructure sits at the center of Metro Manila’s urban value shift. Existing MRT and LRT lines continue to anchor rental demand along established corridors, while new lines and extensions fundamentally redraw commuting maps. Rail does not simply move people; it redefines where people are willing to live.
Districts connected to reliable rail systems consistently outperform because they expand tenant catchment areas without increasing travel time. This effect compounds as lines mature, stations integrate with mixed-use developments, and feeder transport improves.
Rail and Bus Stations as Micro-Markets
Properties within walking distance of rail or major bus stations command measurable premiums. They lease faster, experience shorter vacancy periods, and retain value more effectively during market slowdowns. This pattern is not speculative—it is observable across completed transit corridors where convenience converts directly into pricing power.
Stations create micro-markets. The closer a property sits to predictable, daily mobility, the more resilient its demand profile becomes.
Expressways and Major Road Networks
Expressways, skyways, circumferential roads, and radial connectors reduce friction between cities and districts. Their impact is less about distance and more about time certainty. Areas once considered impractical reprice quickly once travel times become reliable and repeatable.
In Metro Manila, the market does not reward kilometers reduced—it rewards minutes saved. Residential districts with direct expressway access often outperform comparable locations without it, even when they sit farther from CBDs on a map.
Airport Access and Logistics Connectivity
Proximity to Ninoy Aquino International Airport and major logistics corridors supports demand from expatriates, frequent travelers, aviation-linked professionals, and corporate tenants. For investors, this connectivity adds defensive value. During downturns, mobility, flexibility, and access to regional and international routes become decisive advantages that stabilize leasing demand.
Airport-linked locations rarely top affordability lists, but they consistently score high on resilience and liquidity.
Government-Led Urban Redevelopment
Large-scale, government-backed redevelopment acts as a demand catalyst where none previously existed. Regeneration of former industrial zones, underutilized districts, and newly designated CBDs reshapes land use, attracts private capital, and establishes long-term value anchors.
These projects do not reward impatience. Early phases involve uncertainty and construction disruption; later phases reward those who entered once fundamentals—access, employment, services—were locked in. Timing separates participants from spectators.
How Infrastructure Changes Property Values
Infrastructure-driven price movement in Metro Manila follows a predictable three-phase pattern:
Speculation phase:
Triggered by announcements, approvals, and renderings. Prices lift quickly, often ahead of actual demand.
Construction phase:
Volatility increases. Delays, noise, and uncertainty test holding power. This is where weak hands exit.
Completion phase:
Mobility improves, tenant demand validates pricing, and value becomes defensible.
Short-term players chase the first phase. Long-term performers focus on the third. Sustainable ROI in Metro Manila comes from aligning with infrastructure that actually solves access and mobility problems, not from betting on announcements alone. When projects shorten commutes, expand employment reach, and integrate residential, commercial, and transport functions, property values follow with consistency—not hype.
Lifestyle, Convenience, and Livability
Livability is where real estate decisions in Metro Manila become personal—and where long-term value quietly compounds. Prices and rental yields may drive initial interest, but daily lived experiencedetermines whether residents stay, renew leases, and advocate for a location. In a region defined by density and constrained time, convenience is not a lifestyle upgrade; it is a measurable advantage. Where people choose to live ultimately dictates how they spend their time, energy, and routines—and that choice directly shapes property performance.

Work–Life Proximity
Proximity to employment centers is one of the most consistent drivers of satisfaction and rental demand in Metro Manila. Properties near CBDs, mixed-use estates, and transit-connected corridors consistently outperform because they return time to residents. In practical terms, reducing a daily commute by even thirty minutes often delivers more perceived value than adding several square meters to a unit. This is why CBD-adjacent neighborhoods and rail-served districts command premiums and experience faster lease-up.
Access to Education
Access to reputable universities and international schools anchors residential demand. Neighborhoods within established school catchments attract families, expatriates, and faculty housing demand, creating defensive value characteristics. Education-driven demand tends to be stable across cycles because schooling decisions are rarely deferred, even during economic slowdowns. Properties near these institutions benefit from predictable occupancy and long-term desirability.
Healthcare Access
Proximity to major hospitals and medical hubs is an underappreciated driver of livability and demand. Medical centers generate non-cyclical housing needs from doctors, nurses, support staff, patients’ families, and long-stay visitors. Residential properties near established hospitals often experience steady rental absorption, particularly in mid-range segments, and show resilience during broader market volatility.
Retail, Dining, and Leisure
Lifestyle infrastructure transforms neighborhoods from merely functional to genuinely desirable. Integrated retail, dining, parks, and cultural venues increase foot traffic, strengthen community activity, and improve tenant retention. In Metro Manila, districts with lifestyle malls and accessible open spaces consistently outperform comparable areas without them, supporting both rental performance and resale appeal.
Walkability vs. Car Dependence
The final trade-off is between walkable, transit-oriented living and car-dependent, space-oriented environments. Walkable zones—typically found in CBDs and master-planned developments—appeal to renters, young professionals, and expatriates who prioritize access and flexibility. Car-dependent areas offer more space and lower density, making them attractive to families and long-term owners, but they rely heavily on road infrastructure and traffic conditions.
Neither model is inherently superior. Performance depends on alignment with resident priorities. Properties that match how people actually live—not how they aspire to live—consistently deliver stronger occupancy, satisfaction, and long-term value in Metro Manila.
Cost of Living and Ownership Reality Check
This is where many financially sound decisions quietly turn stressful.
Affordability in Metro Manila is not determined by purchase price alone. In real-world ownership, recurring costs—not the headline price—are the most common source of long-term financial strain. Taxes, fees, utilities, and management realities compound over time, and buyers who fail to model these accurately often feel pressure long after the deed is signed. A realistic cost-of-living assessment is not optional here; it is part of due diligence.
Acquisition Costs and Upfront Expenses
Beyond the contract price, buyers must account for transfer taxes, registration fees, documentary stamp taxes, and notarial costs. These are predictable, regulated expenses, but they are material and must be budgeted upfront. Financing introduces additional layers through interest, bank fees, and insurance requirements. Precision at this stage prevents cash-flow stress later. Buyers who underestimate acquisition costs often compromise liquidity before ownership even begins.
Association Dues and Ongoing Maintenance
Ongoing costs define the ownership experience. Condominium owners pay monthly association duescovering security, shared amenities, building maintenance, and administration. Well-managed developments justify higher dues by preserving asset quality, tenant appeal, and resale value. Poor management quietly erodes returns through deferred maintenance and declining desirability.
House-and-lot owners avoid association dues in some cases, but the responsibility does not disappear—it shifts. Roofing, exterior repairs, landscaping, pest control, and security become direct expenses. The difference is not whether costs exist, but how predictable they are. Condos offer structured expenses; houses offer flexibility with higher variability.
Utilities and Transportation Costs
Utilities—electricity, water, internet, and mobile services—vary by building efficiency, household size, and usage patterns. Transportation costs are where location decisions reveal their long-term impact. Walkable neighborhoods and transit-adjacent districts reduce fuel, parking, tolls, and ride-hailing expenses. Car-dependent locations often appear cheaper at entry but carry higher recurring mobility costs that accumulate quietly over time.
In Metro Manila, time spent commuting has a cost—financial, physical, and emotional. Properties that reduce daily travel friction consistently deliver better ownership satisfaction and tenant retention.
Ownership Realities for OFWs and Overseas Buyers
Ownership becomes more nuanced for OFWs and overseas buyers. Distance introduces reliance on property managers, caretakers, or leasing agents. Vacancies, repairs, tenant coordination, and compliance issues must be handled without physical presence. Condominiums with professional management typically suit absentee owners better, offering standardized operations and faster leasing. Houses require stronger local oversight and trusted contacts.
Liquidity matters more for this group. Assets that are easy to rent or resell reduce exposure when circumstances change. In Metro Manila, flexibility is a form of risk management.
Typical Recurring Costs: Condominium vs. House-and-Lot (Philippines)
| Cost Category | Condominium Unit | House-and-Lot |
|---|---|---|
| Association Dues / HOA Fees | PHP 90 – 150 per sqm per month (e.g., PHP 4,500 – 9,000 for a 50–60 sqm unit). Covers security, amenities, common area maintenance, admin. | PHP 1,000 – 5,000 per month (if inside a subdivision). Often limited to gate security and road maintenance. Some houses have none. |
| Property Tax (Real Property Tax) | ~0.5% – 2% of assessed value annually. Typically lower absolute peso amount due to smaller lot share. | ~0.5% – 2% of assessed value annually. Usually higher due to land value appreciation. |
| Maintenance & Repairs | PHP 1,000 – 3,000 per month. Interior-only repairs; structure and exterior handled by the building. Predictable and capped. | PHP 3,000 – 10,000+ per month (averaged). Includes roof, exterior walls, plumbing, gates, fencing. Costs spike with age. |
| Building Insurance | Often bundled into association dues or minimal add-on (PHP 200 – 500/month). | Separate homeowner’s insurance: PHP 1,000 – 3,000/month depending on coverage and rebuild value. |
| Utilities (Electricity, Water) | Electricity: PHP 3,000 – 6,000/month. Water: PHP 500 – 1,500/month. Smaller space = lower baseline consumption. | Electricity: PHP 5,000 – 10,000+/month. Water: PHP 1,000 – 3,000/month. Larger space, outdoor use. |
| Security Costs | Included in association dues (24/7 guards, CCTV, access control). | PHP 0 – 3,000/month if hiring private security or contributing to barangay/subdivision guards. |
| Garbage Collection & Common Services | Included in dues. | Usually covered by LGU, but private hauling may cost PHP 500 – 1,500/month in some areas. |
| Parking Fees | PHP 2,000 – 5,000/month if parking slot is rented separately or billed as recurring fee. | Usually none if parking is within the property. |
| Special Assessments / Major Repairs | Occasional one-time assessments (e.g., façade repainting, elevator upgrades). Typically planned years ahead. | Fully owner-borne. Major repairs (roof replacement, flooding mitigation) can run into six figures unexpectedly. |
| Landscaping / Outdoor Maintenance | Not applicable (common areas handled by admin). | PHP 1,000 – 4,000/month for gardening, pest control, tree trimming. |
The takeaway is direct: successful ownership in Metro Manila rewards buyers who budget for total cost, not just entry price. Those who model the full financial picture—upfront, recurring, and operational—protect both their capital and their peace of mind.
Buying vs Renting in Metro Manila: Making the Right Housing Decision
The decision to buy or rent in Metro Manila is not ideological—it is context-driven. The financially sound choice depends on time horizon, income stability, location certainty, and lifestyle priorities. Most costly mistakes occur when buyers force ownership too early or renters delay ownership beyond the point where it makes strategic sense. In Metro Manila’s dense and dynamic market, clarity matters more than conviction.
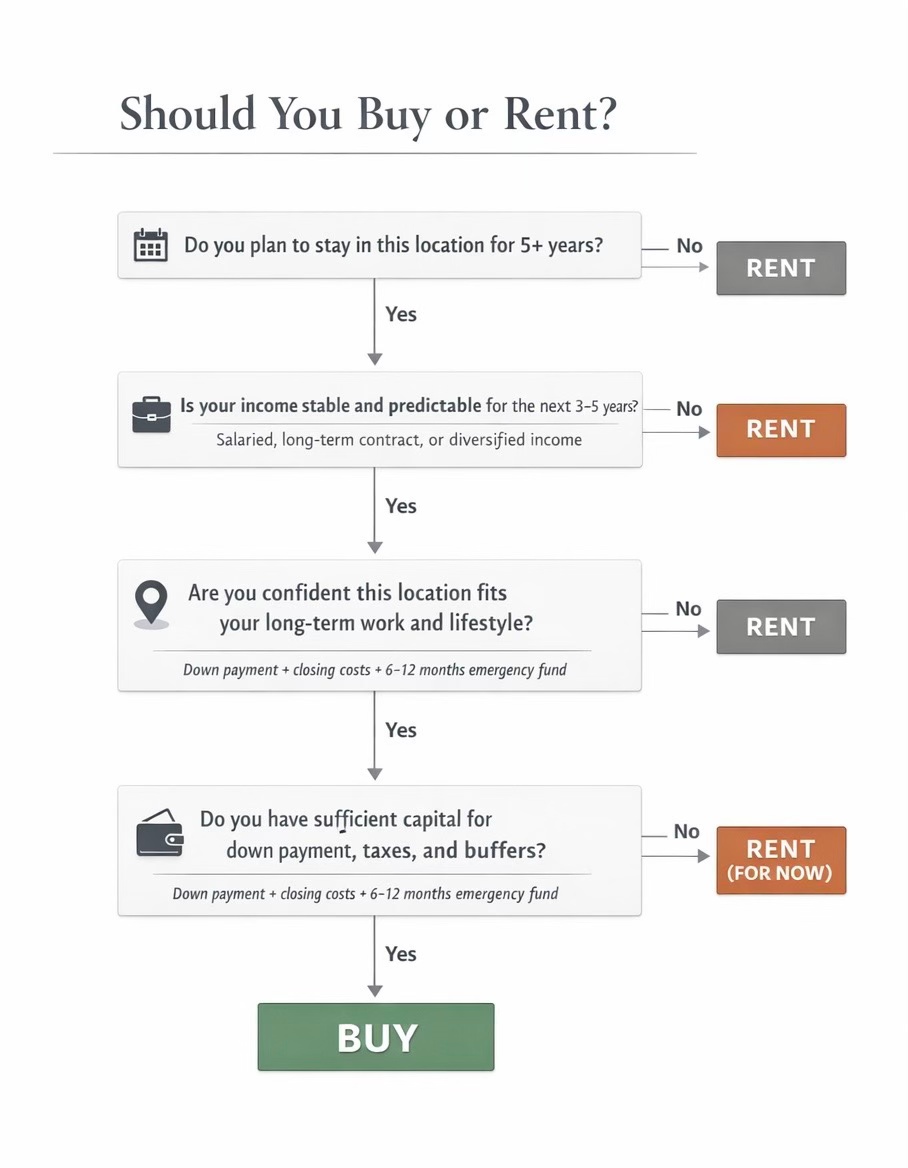
Use this quick decision guide to pressure-test whether buying or renting fits your situation.
When Buying Makes Sense
Buying property in Metro Manila becomes financially rational when location and tenure are clear. Long-term employment in a specific district, predictable income, and a holding period that extends beyond market cycles tilt the equation toward ownership. Buyers who commit under these conditions lock in current prices, hedge against long-term rent inflation, and participate in capital appreciation driven by demand and land scarcity.
For families and OFWs establishing a permanent base, ownership transforms housing from a recurring expense into a controlled asset. In well-located areas, this often delivers both lifestyle stability and long-term wealth preservation—provided the property aligns with actual living needs.
When Renting Is the Smarter Option
Renting is strategically superior when flexibility carries value. Early-career professionals, expatriates, and mobile households benefit from the ability to change locations without transaction friction. Renting enables proximity to CBDs and employment hubs at a lower upfront cost, preserves capital for other uses, and transfers maintenance and management risk to the owner.
In premium districts with high entry prices, renting can outperform buying in the short to medium term—especially when opportunity cost and lifestyle optionality are considered. In Metro Manila, renting is often a strategic choice, not a fallback.
How Location Shapes the Buy-or-Rent Decision
Housing profiles in Metro Manila vary sharply by district type. CBD cores attract renters—young professionals, expatriates, and corporate tenants—who prioritize access and convenience over permanence. Residential cities skew toward owner-occupiers, families, and long-hold buyers who value space, schools, and community infrastructure. Emerging districts draw a hybrid market: renters testing new locations and buyers positioning ahead of infrastructure delivery and area maturation.
Understanding where demand naturally clusters helps clarify whether buying or renting aligns better with a given location.
The Strategic Takeaway
There is no universal answer. The correct decision aligns housing choices with career trajectory, capital deployment, and lifestyle intent. In Metro Manila, flexibility is not a weakness—it is often a form of financial discipline.
When the buy-versus-rent decision feels evenly balanced, a location-specific cost and lifestyle comparison—factoring in commute time, ownership costs, and holding period—usually resolves the question quickly and objectively.
Risks, Challenges, and Common Misconceptions in Metro Manila Real Estate
Risk in Metro Manila is rarely hidden—but it is frequently misunderstood. Most perceived risks are not market-wide failures; they are location-specific and execution-dependent variables. Poor outcomes usually stem from assumptions left untested, not from problems that could not have been anticipated. This section separates structural realities from persistent myths that distort decision-making.
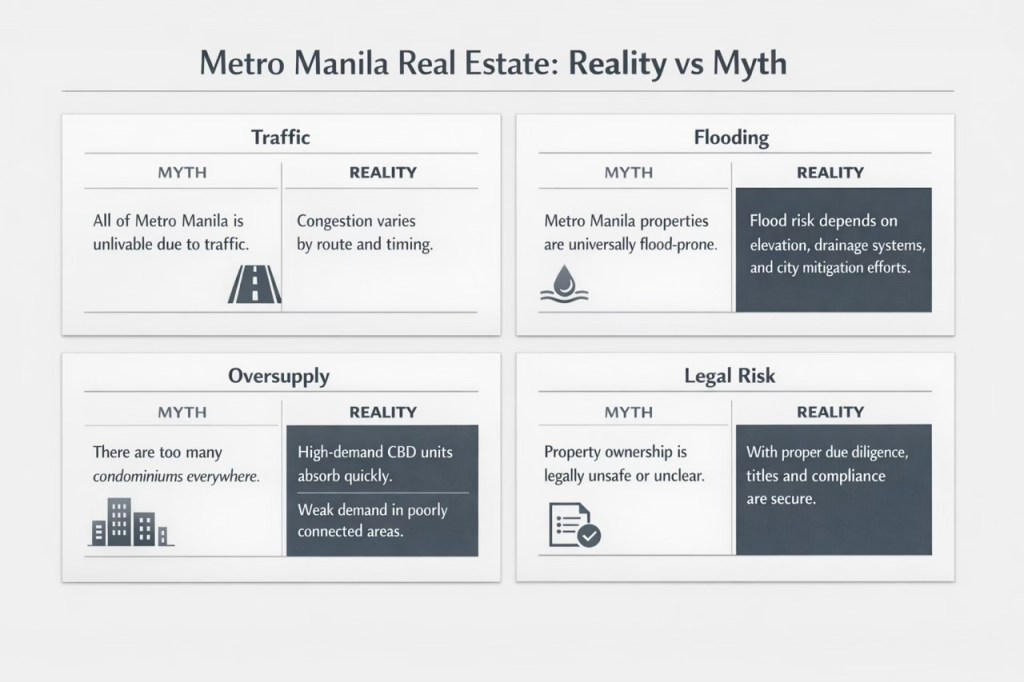
Traffic and Congestion: A Location Problem, Not a City Problem
Traffic in Metro Manila is real, but it is unevenly distributed. Commute pain is driven by route design, access to transit, and travel timing—not simply distance. Properties near CBDs, rail stations, and mixed-use estates consistently outperform because they reduce daily friction. The most common mistake is buying “cheap but far” and paying the difference in time, fuel, stress, and burnout. Over time, those hidden costs erode both livability and returns.
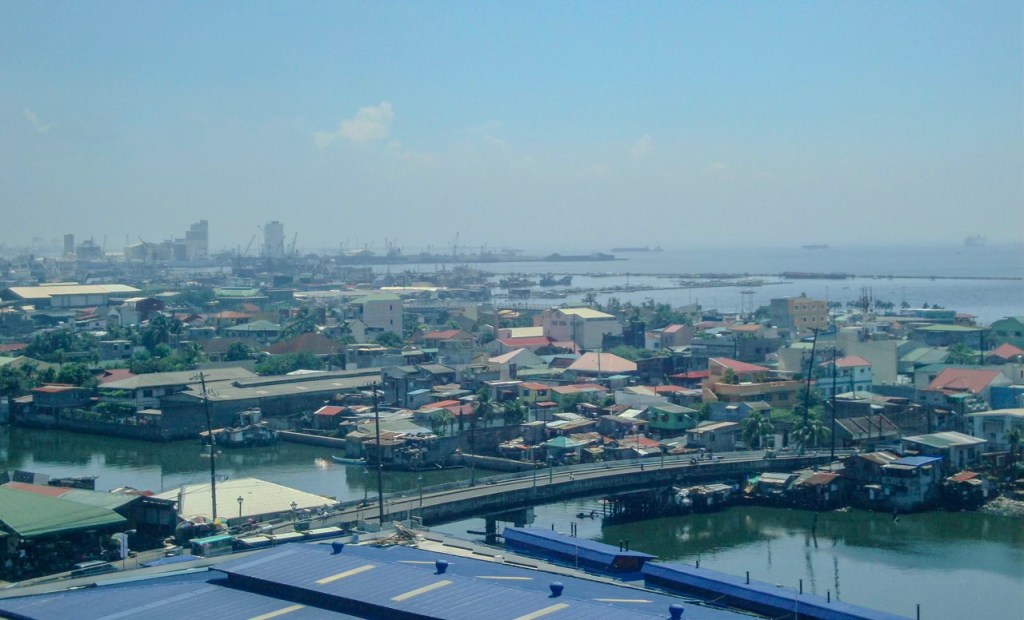
Flood Risk: Highly Localized, Often Overgeneralized
Flooding is another area where broad labels mislead. Metro Manila does have flood-prone pockets, but flood risk is highly localized. Elevation, drainage capacity, river proximity, and city-level mitigation matter far more than city names. Well-planned developments and upgraded districts have materially reduced exposure, while older low-lying areas demand stricter due diligence. Avoiding the entire market due to flood fear is an overcorrection that eliminates viable opportunities.
Oversupply: A Mismatch, Not a Market Glut
“Oversupply” is the most repeated—and least precise—concern. Metro Manila does not suffer from blanket oversupply; it experiences mismatched supply. Certain segments and locations absorb inventory slowly, while others lease out immediately. Studios in transit-accessible CBDs behave very differently from large units in poorly connected areas. Supply without demand alignment is the issue—not total volume.
Title, Zoning, and Compliance: Real Risks That Are Manageable
Legal and compliance risks are real and non-negotiable. Incomplete titles, improper land classification, and zoning violations can freeze transactions or destroy resale value. These risks are manageable with proper verification, developer screening, and professional guidance. They become catastrophic only when ignored or rushed. In Metro Manila, due diligence is not a formality; it is a safeguard.
The Strategic Reality Check
The pattern is consistent: buyers who rely on headlines hesitate; buyers who rely on specifics decide correctly. Most risks become manageable once identified early. Structured due diligence removes far more uncertainty than waiting on market “clarity.”
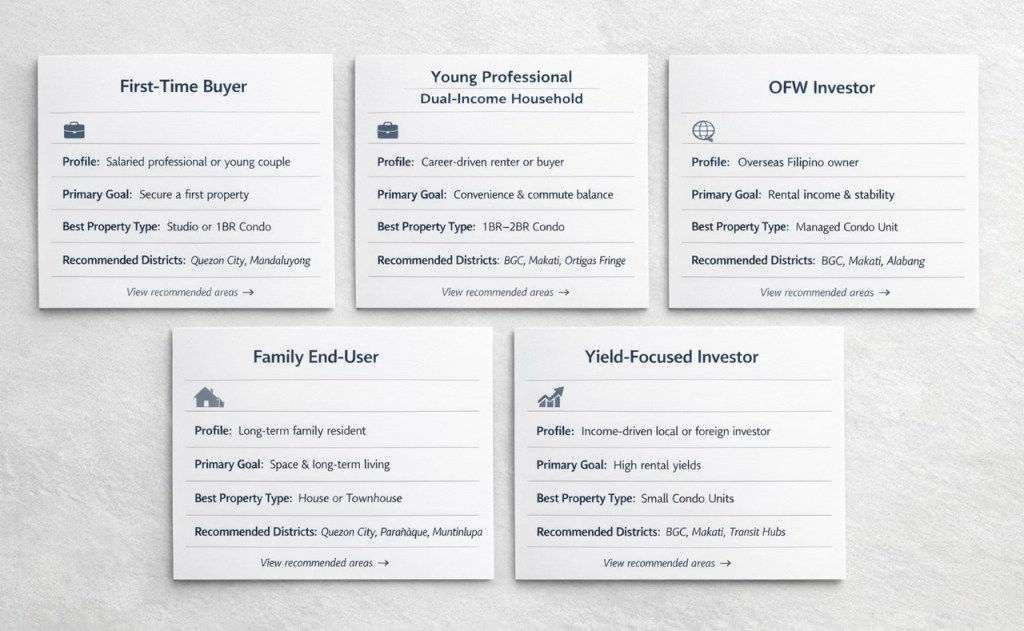
Who Should Seriously Consider Metro Manila Real Estate
Real estate in Metro Manila is not a universal solution—but for the right buyer profiles, it remains the most rational, liquid, and defensible property market in the Philippines. Success here depends on alignment between buyer intent, financial capacity, holding period, and location strategy. When those align, Metro Manila consistently outperforms less mature markets on liquidity, demand depth, and long-term relevance.
First-Time Buyers
First-time buyers benefit most from Metro Manila’s market depth and optionality. Entry-level condominiums in secondary CBDs or well-connected residential cities provide direct access to employment centers, transport networks, and resale liquidity that provincial markets struggle to match. The advantage is not unit size; it is starting in a market where demand is proven. For first-time buyers, Metro Manila reduces downside risk while preserving future flexibility.
Young Professionals and Families
Young professionals and growing families gravitate toward districts that balance access and livability. Dual-income households prioritize proximity to work, schools, and healthcare, while still demanding manageable commutes and stable community infrastructure. Residential cities and mixed-use estates meet this need, offering lifestyle upgrades without full exposure to CBD pricing. For this group, Metro Manila provides scalability—housing that evolves with career and family stages.
OFWs (Overseas Filipino Workers)
OFWs remain one of the strongest and most consistent demand pillars. Metro Manila delivers what overseas buyers value most: liquidity, rental depth, and long-term relevance. Condominiums with professional property management suit absentee ownership, while locations near CBDs and transport hubs minimize vacancy risk. For OFWs, Metro Manila real estate is less about short-term speculation and more about capital preservation with controlled upside.
Local and Foreign Investors (Within Legal Limits)
Local and foreign investors are drawn to Metro Manila because of its relative transparency, tenant diversity, and exit options. Rental demand from professionals, expatriates, and corporate tenants supports income-driven strategies, while infrastructure expansion and urban redevelopment underpin appreciation plays. Discipline is critical: location quality and developer credibility matter far more than headline yields or promotional projections.
Corporate Tenants and Executives
Corporate tenants and senior executives anchor the premium segment. Demand for high-quality residences near business districts, airports, and international schools remains resilient across cycles. This segment supports longer lease tenures, stable occupancy, and premium pricing in select locations. For owners, this translates into predictable leasing behavior and stronger asset defensibility.
The Unifying Factor: Intent
The common thread across all successful buyers is clarity of intent. Metro Manila rewards those who know why they are buying, how long they plan to hold, and what role the property is meant to play—income, growth, livability, or capital preservation. In a market this deep and competitive, intention is not optional; it is the strategy.
Strategic Takeaways Before You Decide
Successful real estate decisions in Metro Manila are made when strategy leads and emotion follows. This is a deep, liquid, and competitive market—one that rewards preparation and punishes shortcuts. The following takeaways act as decision filters, separating disciplined outcomes from costly missteps.
Choose the Right City—and District—for Your Objective
Start with your objective, not your budget. If the goal is rental stability, prioritize employment density, transit access, and tenant churn patterns—even when entry prices appear high. These factors protect occupancy and liquidity. If the goal is long-term livability, weigh school access, healthcare, flood mitigation, and neighborhood maturity more heavily than headline yields. For appreciation-driven strategies, focus on locations where infrastructure resolves a real constraint—shorter commutes, better access, integrated land use—rather than areas driven by promotional noise.
Match Property Type to Strategy
Property type alignment is non-negotiable. Studios and one-bedroom units excel at liquidity and leasing velocity. Larger units and landed homes favor end-use satisfaction and longer holding periods. Mixed-use developments trade a premium for resilience and convenience. Commercial assets require active management and experience. Most underperformance in Metro Manila traces back to misalignment here—buying an asset that cannot realistically deliver the intended outcome.
Timing Matters—Within Limits
Buying during market softness helps, but waiting for a “perfect” bottom rarely does. What matters more is entering before demand crystallizes and holding through the completion of value drivers—jobs, transport, and essential services. Time spent in the right micro-market consistently outperforms attempts to outguess short-term cycles.
Precision Beats Prediction
Location precision beats market timing every time. Metro Manila is not a single bet; it is a portfolio of micro-markets, each governed by different demand mechanics. Two properties purchased in the same year can perform very differently based solely on where they sit. Across cycles, disciplined buyers who anchor decisions on demand fundamentals and micro-location selection consistently outperform those reacting to headlines.
Choose deliberately. Metro Manila rewards clarity.
Next Steps — How to Choose the Right Property in Metro Manila
Clarity beats browsing. The fastest and most reliable way to make the right move in Metro Manila is a consultation-driven decision process that narrows options before emotion takes over. This is not about seeing more listings; it is about eliminating the wrong choices earlyso every site visit has a purpose.
Start With a Focused Consultation
Begin by defining four non-negotiables: objective, budget structure, time horizon, and risk tolerance. Once these are clear, recommendations become precise rather than generic—CBD cores for rental stability and liquidity, residential cities for family living and long-term use, emerging districts for appreciation-led strategies. Precision at this stage prevents wasted site visits, misaligned expectations, and costly second-guessing later.
Choose Your Pathway Deliberately
Next, decide whether the property is primarily an investment asset or an end-use home.
Investment-focused buyers should evaluate yield durability, tenant depth, developer track record, and exit liquidity. End-users should prioritize daily convenience, long-term livability, and total ownership costs over speculative upside. These pathways overlap, but they are not interchangeable. Treating them as the same leads to compromise outcomes that satisfy neither goal.
Execute With Discipline
The final step is disciplined execution. Shortlist a small number of properties that meet your criteria, verify legal title, zoning, and compliance, and assess holding costs realistically. Speed is not the objective—confidence is. In a market as nuanced as Metro Manila, the right decision is rarely about moving fast; it is about choosing correctly the first time.
Metro Manila does not reward broad assumptions. It rewards buyers who understand that every decision here is local, strategic, and intentional.


Leave a comment